Download
1 / 1
10 likes | 25 Views
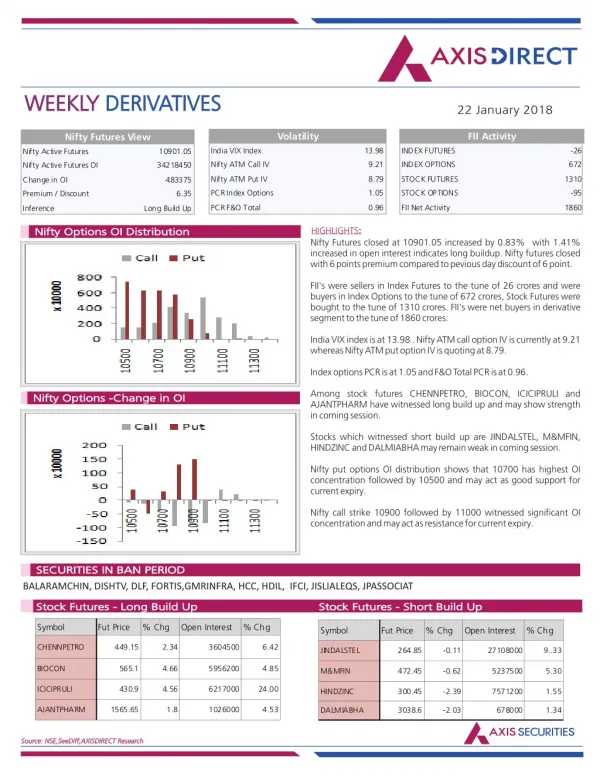
Axis Direct presents daily derivatives report presenting recommendations based on technical analysis. For trading in derivatives visit https://simplehai.axisdirect.in/offerings/products/derivatives<br>https://simplehai.axisdirect.in/share-stock-prices/nse/Tata-Motors-Ltd-560<br>https://simplehai.axisdirect.in/share-stock-prices/nse/Coal-India-Ltd-12019

E N D
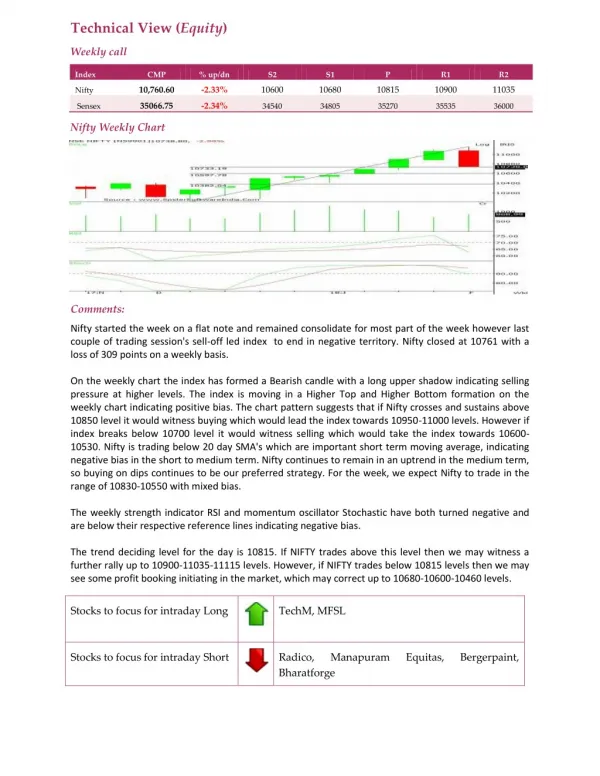
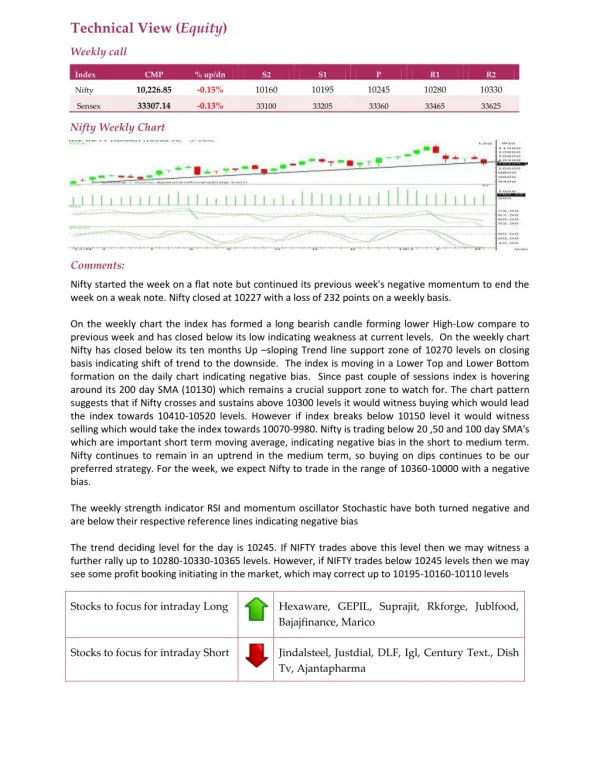
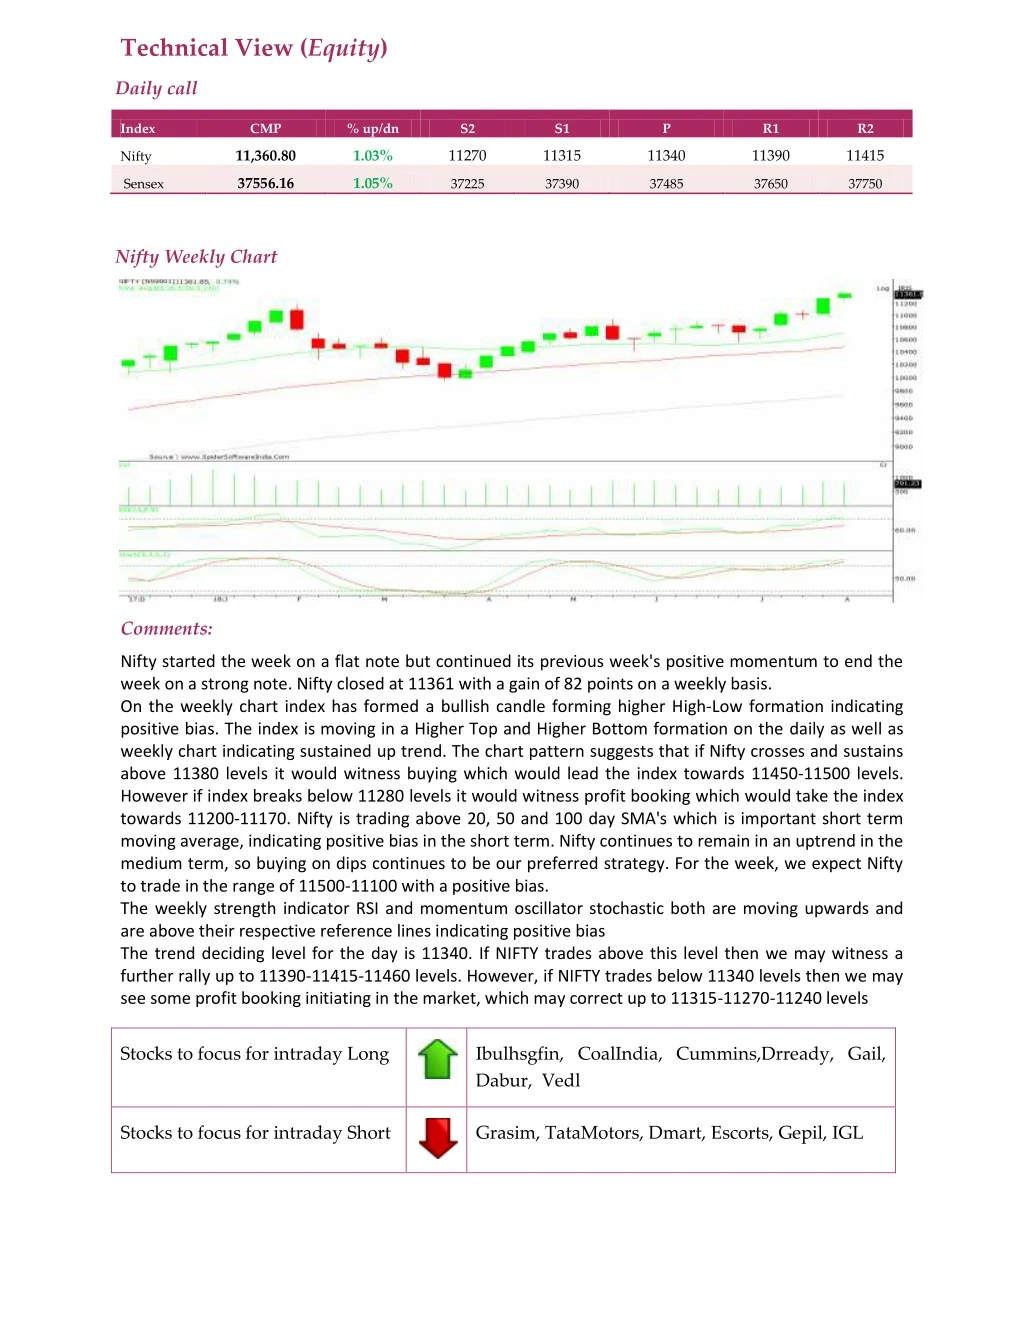
Technical View (Equity) Daily call Index CMP % up/dn S2 S1 P R1 R2 11,360.80 1.03% 11270 11315 11340 11390 11415 Nifty 37556.16 1.05% Sensex 37225 37390 37485 37650 37750 Nifty Weekly Chart Comments: Nifty started the week on a flat note but continued its previous week's positive momentum to end the week on a strong note. Nifty closed at 11361 with a gain of 82 points on a weekly basis. On the weekly chart index has formed a bullish candle forming higher High-Low formation indicating positive bias. The index is moving in a Higher Top and Higher Bottom formation on the daily as well as weekly chart indicating sustained up trend. The chart pattern suggests that if Nifty crosses and sustains above 11380 levels it would witness buying which would lead the index towards 11450-11500 levels. However if index breaks below 11280 levels it would witness profit booking which would take the index towards 11200-11170. Nifty is trading above 20, 50 and 100 day SMA's which is important short term moving average, indicating positive bias in the short term. Nifty continues to remain in an uptrend in the medium term, so buying on dips continues to be our preferred strategy. For the week, we expect Nifty to trade in the range of 11500-11100 with a positive bias. The weekly strength indicator RSI and momentum oscillator stochastic both are moving upwards and are above their respective reference lines indicating positive bias The trend deciding level for the day is 11340. If NIFTY trades above this level then we may witness a further rally up to 11390-11415-11460 levels. However, if NIFTY trades below 11340 levels then we may see some profit booking initiating in the market, which may correct up to 11315-11270-11240 levels Stocks to focus for intraday Long Ibulhsgfin, CoalIndia, Cummins,Drready, Gail, Dabur, Vedl Stocks to focus for intraday Short Grasim, TataMotors, Dmart, Escorts, Gepil, IGL