Download
1 / 1
10 likes | 22 Views
Axis Direct presents daily derivatives report presenting recommendations based on technical analysis. For trading in derivatives visit https://simplehai.axisdirect.in/offerings/products/derivatives<br>https://simplehai.axisdirect.in/share-stock-prices/nse/Tech-Mahindra-Ltd-17215<br>

E N D
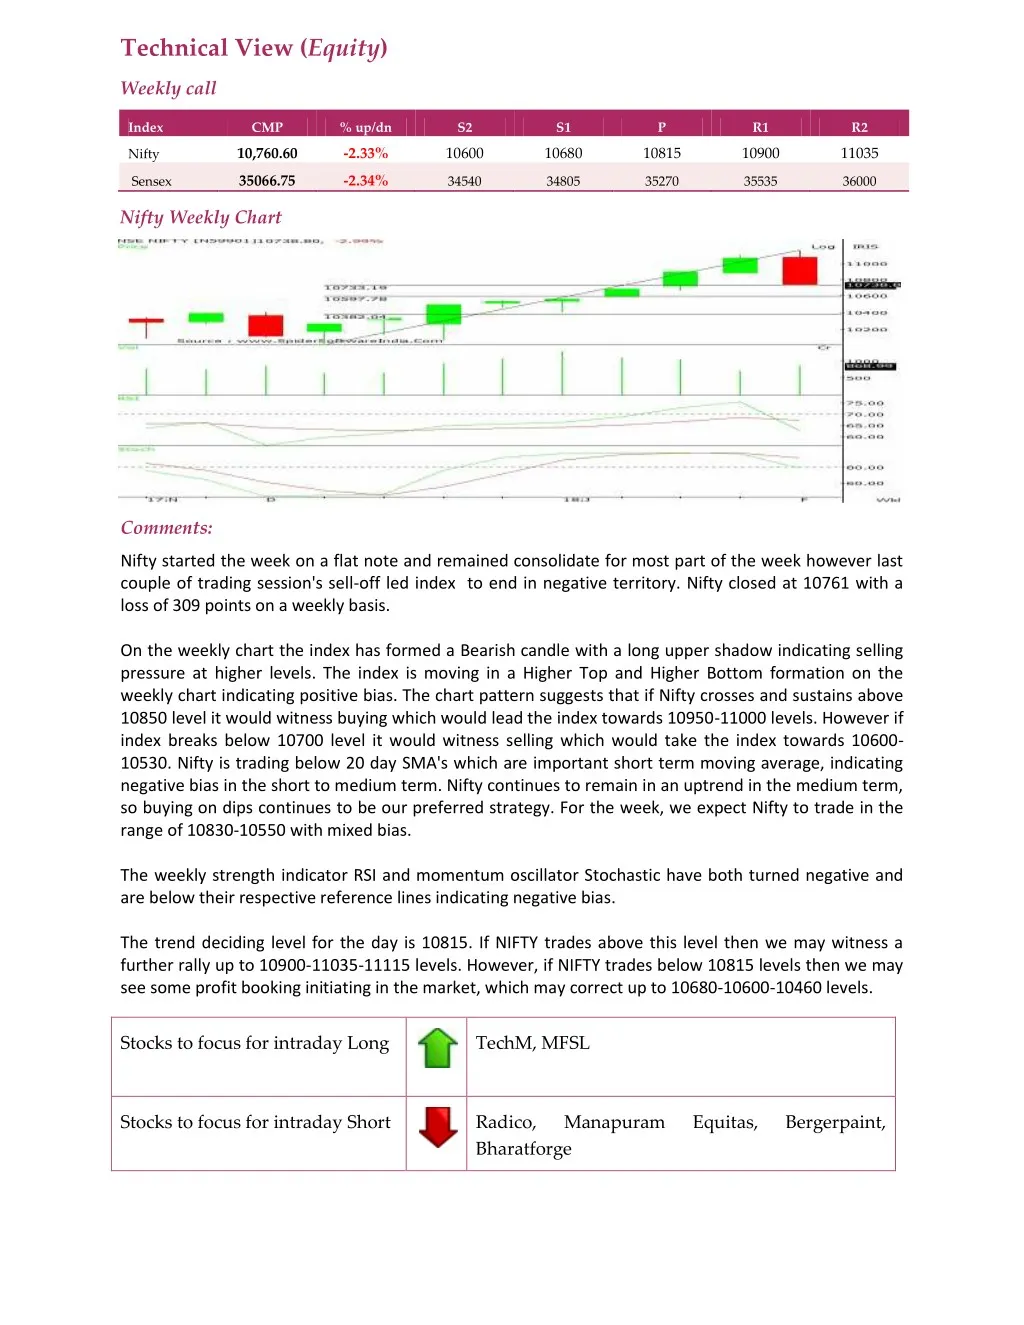
Technical View (Equity) Weekly call Index CMP % up/dn S2 S1 P R1 R2 10,760.60 -2.33% 10600 10680 10815 10900 11035 Nifty 35066.75 -2.34% Sensex 34540 34805 35270 35535 36000 Nifty Weekly Chart Comments: Nifty started the week on a flat note and remained consolidate for most part of the week however last couple of trading session's sell-off led index to end in negative territory. Nifty closed at 10761 with a loss of 309 points on a weekly basis. On the weekly chart the index has formed a Bearish candle with a long upper shadow indicating selling pressure at higher levels. The index is moving in a Higher Top and Higher Bottom formation on the weekly chart indicating positive bias. The chart pattern suggests that if Nifty crosses and sustains above 10850 level it would witness buying which would lead the index towards 10950-11000 levels. However if index breaks below 10700 level it would witness selling which would take the index towards 10600- 10530. Nifty is trading below 20 day SMA's which are important short term moving average, indicating negative bias in the short to medium term. Nifty continues to remain in an uptrend in the medium term, so buying on dips continues to be our preferred strategy. For the week, we expect Nifty to trade in the range of 10830-10550 with mixed bias. The weekly strength indicator RSI and momentum oscillator Stochastic have both turned negative and are below their respective reference lines indicating negative bias. The trend deciding level for the day is 10815. If NIFTY trades above this level then we may witness a further rally up to 10900-11035-11115 levels. However, if NIFTY trades below 10815 levels then we may see some profit booking initiating in the market, which may correct up to 10680-10600-10460 levels. Stocks to focus for intraday Long TechM, MFSL Stocks to focus for intraday Short Radico, Bharatforge Manapuram Equitas, Bergerpaint,
