Download
1 / 1
10 likes | 26 Views
Axis Direct presents daily derivatives report presenting recommendations based on technical analysis. For trading in derivatives visit https://simplehai.axisdirect.in/offerings/products/derivatives

E N D
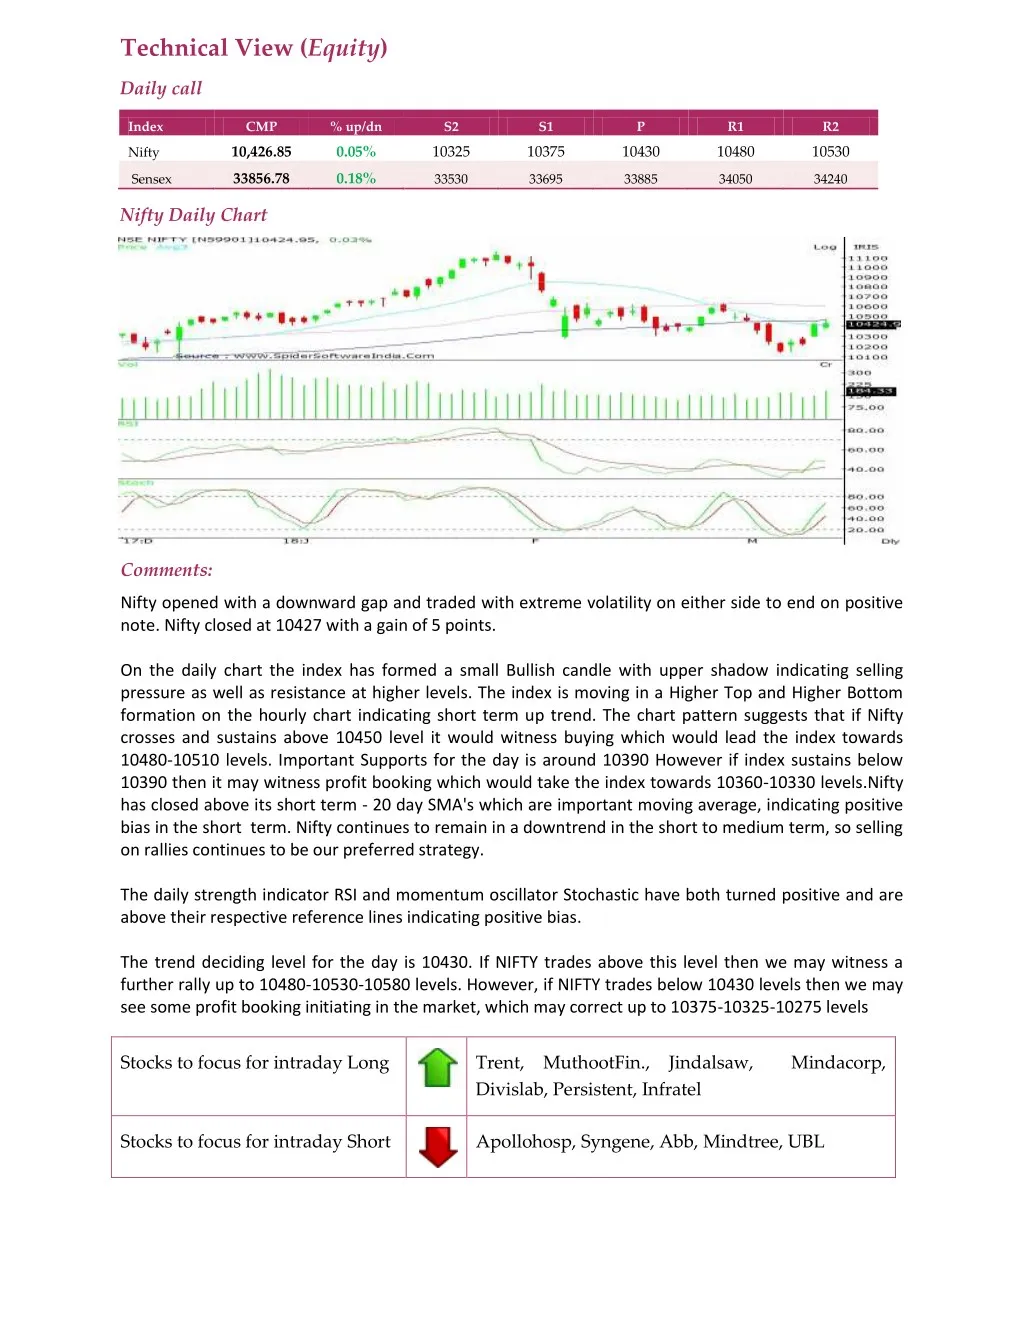
Technical View (Equity) Daily call Index CMP % up/dn S2 S1 P R1 R2 10,426.85 0.05% 10325 10375 10430 10480 10530 Nifty 33856.78 0.18% Sensex 33530 33695 33885 34050 34240 Nifty Daily Chart Comments: Nifty opened with a downward gap and traded with extreme volatility on either side to end on positive note. Nifty closed at 10427 with a gain of 5 points. On the daily chart the index has formed a small Bullish candle with upper shadow indicating selling pressure as well as resistance at higher levels. The index is moving in a Higher Top and Higher Bottom formation on the hourly chart indicating short term up trend. The chart pattern suggests that if Nifty crosses and sustains above 10450 level it would witness buying which would lead the index towards 10480-10510 levels. Important Supports for the day is around 10390 However if index sustains below 10390 then it may witness profit booking which would take the index towards 10360-10330 levels.Nifty has closed above its short term - 20 day SMA's which are important moving average, indicating positive bias in the short term. Nifty continues to remain in a downtrend in the short to medium term, so selling on rallies continues to be our preferred strategy. The daily strength indicator RSI and momentum oscillator Stochastic have both turned positive and are above their respective reference lines indicating positive bias. The trend deciding level for the day is 10430. If NIFTY trades above this level then we may witness a further rally up to 10480-10530-10580 levels. However, if NIFTY trades below 10430 levels then we may see some profit booking initiating in the market, which may correct up to 10375-10325-10275 levels Stocks to focus for intraday Long Trent, MuthootFin., Jindalsaw, Mindacorp, Divislab, Persistent, Infratel Stocks to focus for intraday Short Apollohosp, Syngene, Abb, Mindtree, UBL