Download
1 / 1
10 likes | 28 Views
Axis Direct presents daily derivatives report presenting recommendations based on technical analysis. For trading in derivatives visit https://simplehai.axisdirect.in/offerings/products/derivatives<br>

E N D
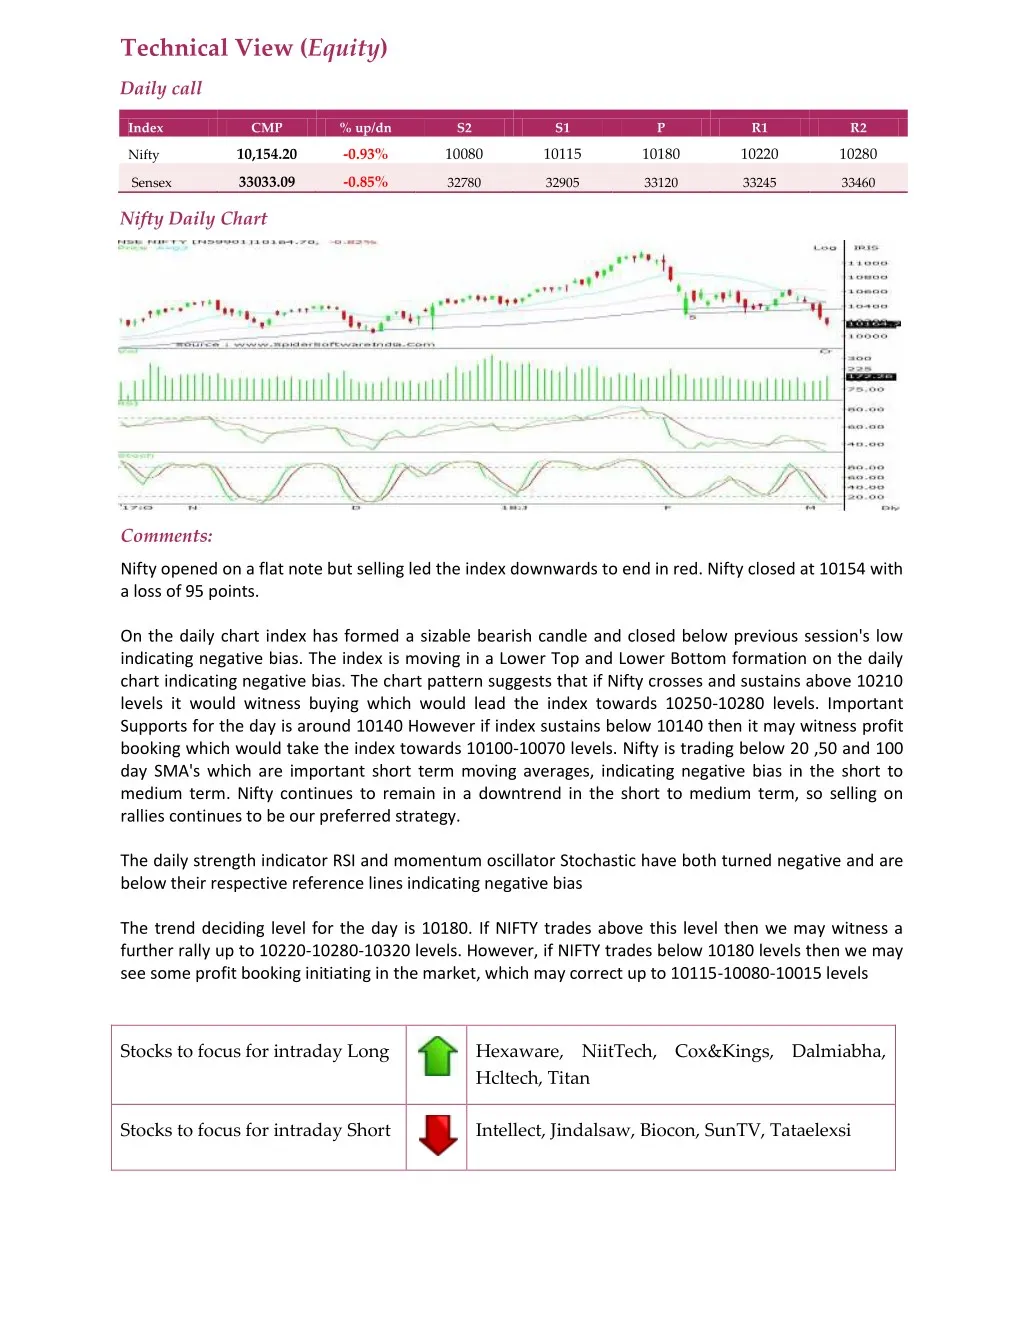
Technical View (Equity) Daily call Index CMP % up/dn S2 S1 P R1 R2 10,154.20 -0.93% 10080 10115 10180 10220 10280 Nifty 33033.09 -0.85% Sensex 32780 32905 33120 33245 33460 Nifty Daily Chart Comments: Nifty opened on a flat note but selling led the index downwards to end in red. Nifty closed at 10154 with a loss of 95 points. On the daily chart index has formed a sizable bearish candle and closed below previous session's low indicating negative bias. The index is moving in a Lower Top and Lower Bottom formation on the daily chart indicating negative bias. The chart pattern suggests that if Nifty crosses and sustains above 10210 levels it would witness buying which would lead the index towards 10250-10280 levels. Important Supports for the day is around 10140 However if index sustains below 10140 then it may witness profit booking which would take the index towards 10100-10070 levels. Nifty is trading below 20 ,50 and 100 day SMA's which are important short term moving averages, indicating negative bias in the short to medium term. Nifty continues to remain in a downtrend in the short to medium term, so selling on rallies continues to be our preferred strategy. The daily strength indicator RSI and momentum oscillator Stochastic have both turned negative and are below their respective reference lines indicating negative bias The trend deciding level for the day is 10180. If NIFTY trades above this level then we may witness a further rally up to 10220-10280-10320 levels. However, if NIFTY trades below 10180 levels then we may see some profit booking initiating in the market, which may correct up to 10115-10080-10015 levels Stocks to focus for intraday Long Hexaware, NiitTech, Cox&Kings, Dalmiabha, Hcltech, Titan Stocks to focus for intraday Short Intellect, Jindalsaw, Biocon, SunTV, Tataelexsi
