Download
1 / 1
10 likes | 15 Views
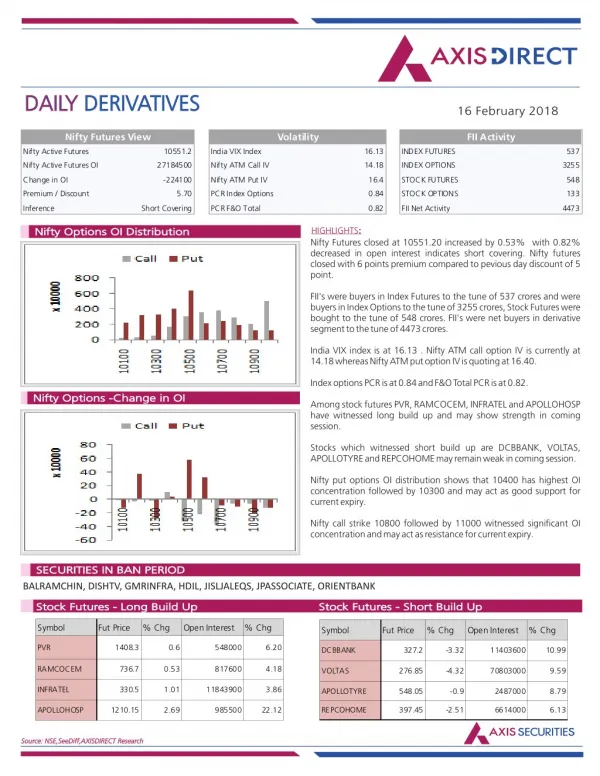
Axis Direct presents daily derivatives report presenting recommendations based on technical analysis. For trading in derivatives visit https://simplehai.axisdirect.in/offerings/products/derivatives<br>https://simplehai.axisdirect.in/share-stock-prices/nse/Asian-Paints-Ltd-34<br>

E N D
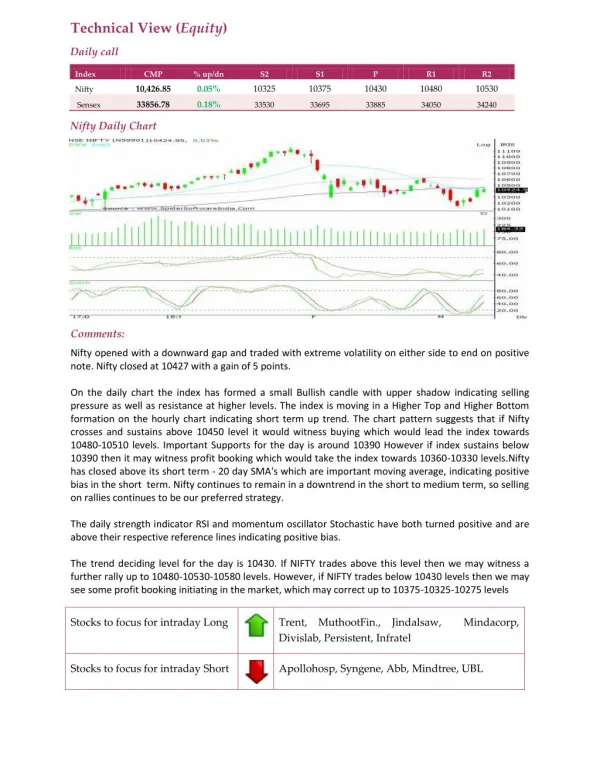
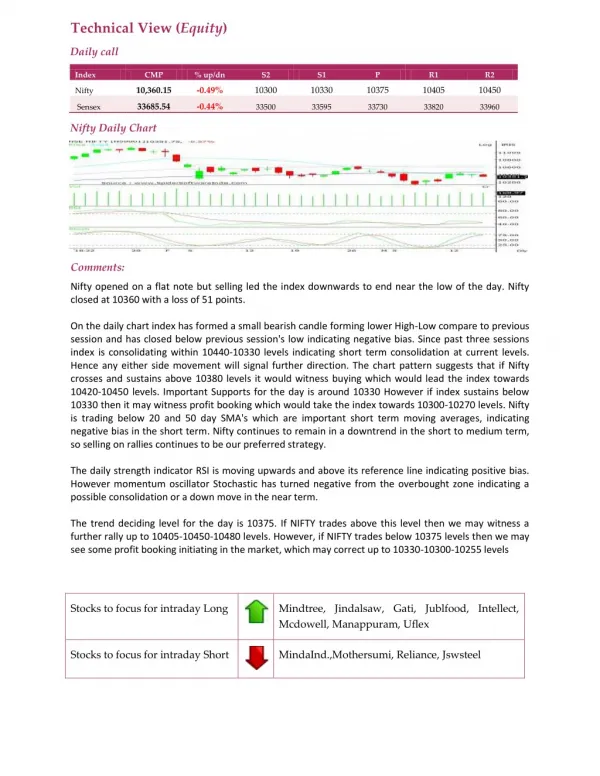
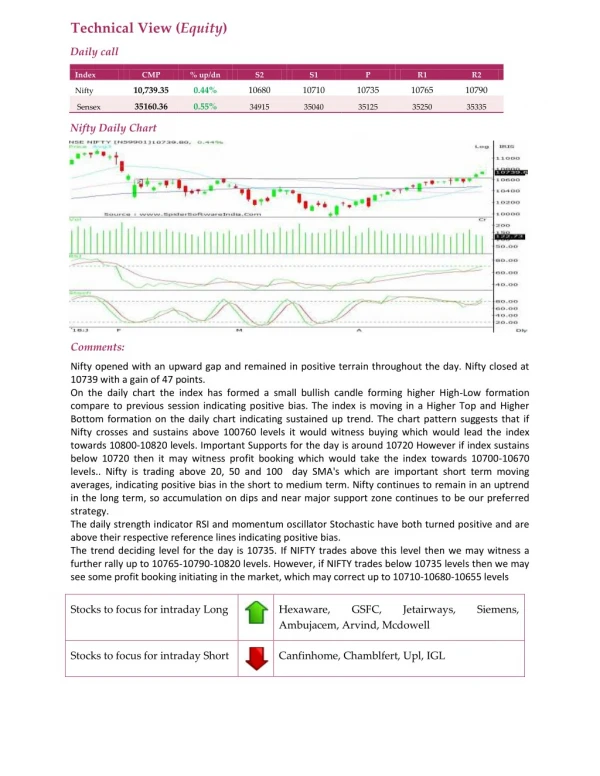
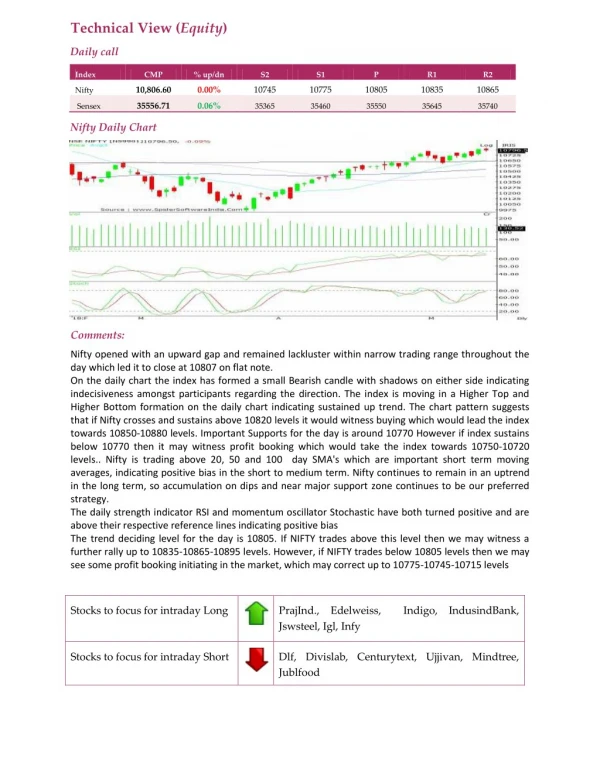
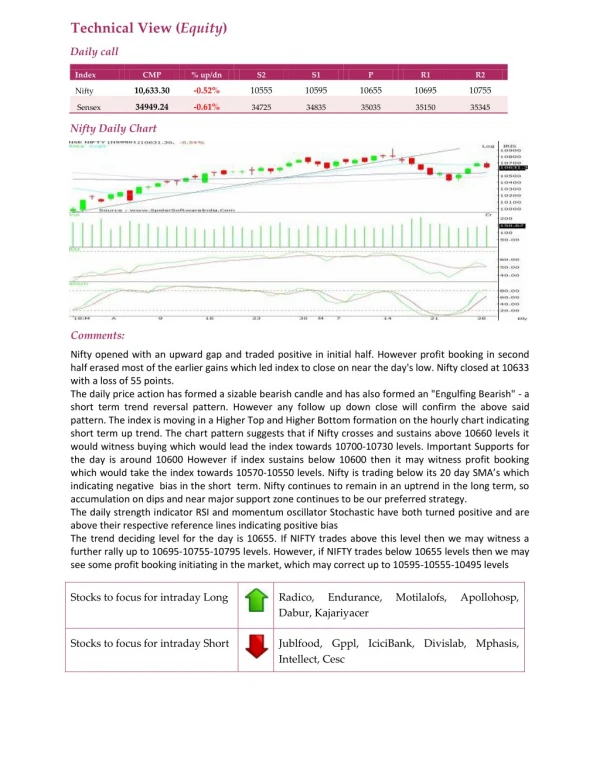
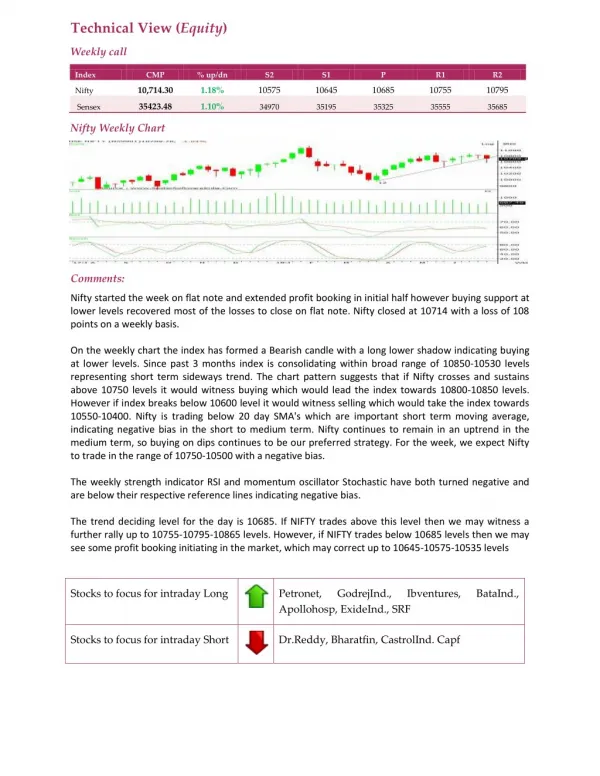
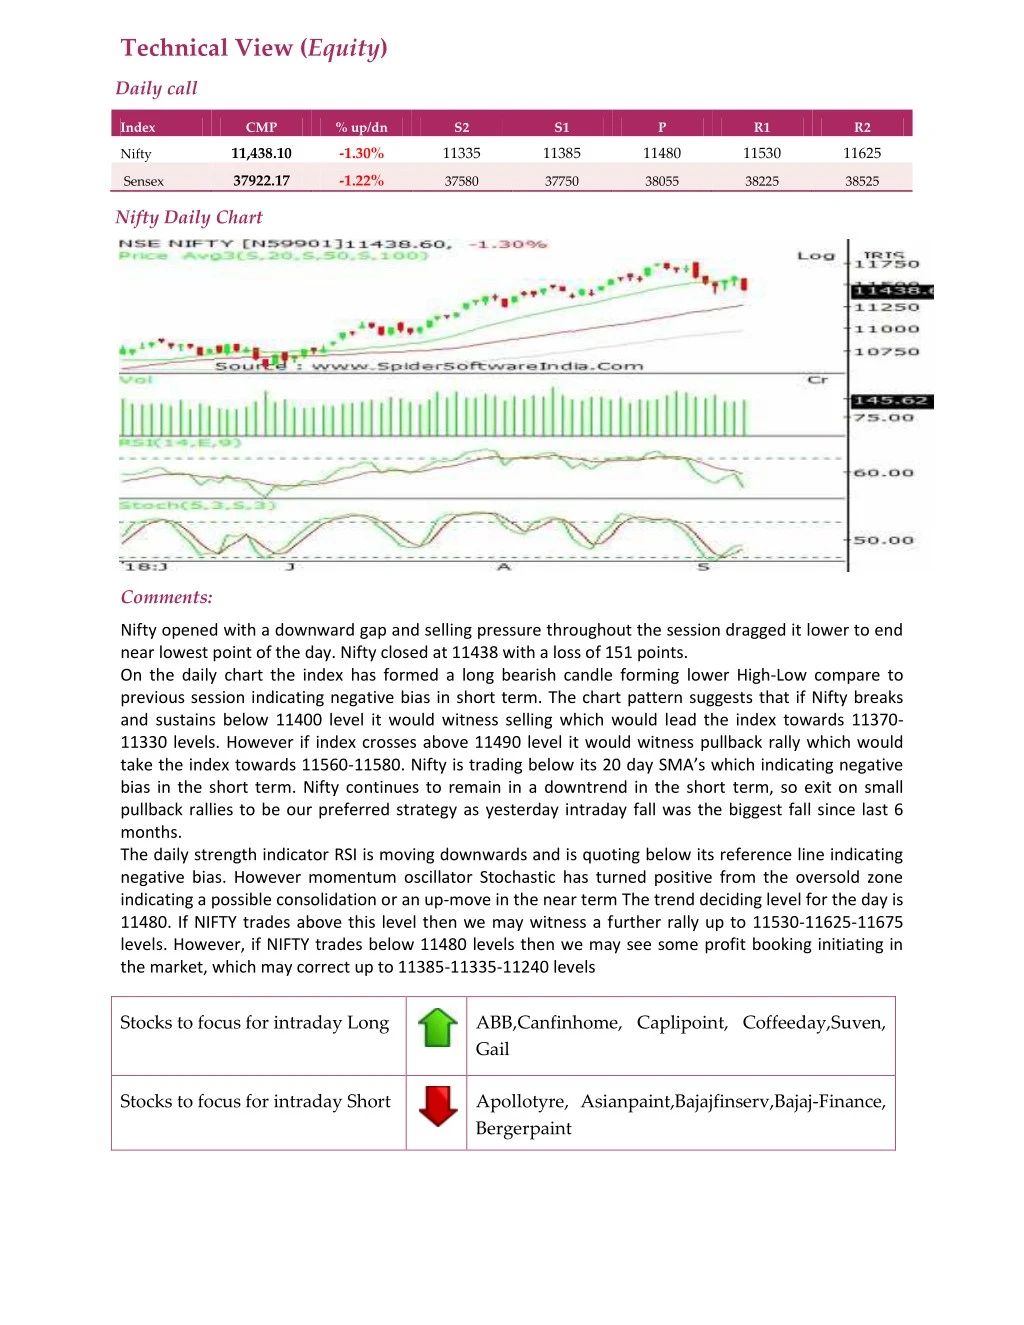
Technical View (Equity) Daily call Index CMP % up/dn S2 S1 P R1 R2 11,438.10 -1.30% 11335 11385 11480 11530 11625 Nifty 37922.17 -1.22% Sensex 37580 37750 38055 38225 38525 Nifty Daily Chart Comments: Nifty opened with a downward gap and selling pressure throughout the session dragged it lower to end near lowest point of the day. Nifty closed at 11438 with a loss of 151 points. On the daily chart the index has formed a long bearish candle forming lower High-Low compare to previous session indicating negative bias in short term. The chart pattern suggests that if Nifty breaks and sustains below 11400 level it would witness selling which would lead the index towards 11370- 11330 levels. However if index crosses above 11490 level it would witness pullback rally which would take the index towards 11560-11580. Nifty is trading below its 20 day SMA’s which indicating negative bias in the short term. Nifty continues to remain in a downtrend in the short term, so exit on small pullback rallies to be our preferred strategy as yesterday intraday fall was the biggest fall since last 6 months. The daily strength indicator RSI is moving downwards and is quoting below its reference line indicating negative bias. However momentum oscillator Stochastic has turned positive from the oversold zone indicating a possible consolidation or an up-move in the near term The trend deciding level for the day is 11480. If NIFTY trades above this level then we may witness a further rally up to 11530-11625-11675 levels. However, if NIFTY trades below 11480 levels then we may see some profit booking initiating in the market, which may correct up to 11385-11335-11240 levels Stocks to focus for intraday Long ABB,Canfinhome, Caplipoint, Coffeeday,Suven, Gail Stocks to focus for intraday Short Apollotyre, Asianpaint,Bajajfinserv,Bajaj-Finance, Bergerpaint