Download
1 / 1
10 likes | 21 Views
Axis Direct presents daily derivatives report presenting recommendations based on technical analysis. For trading in derivatives visit https://simplehai.axisdirect.in/offerings/products/derivatives

E N D
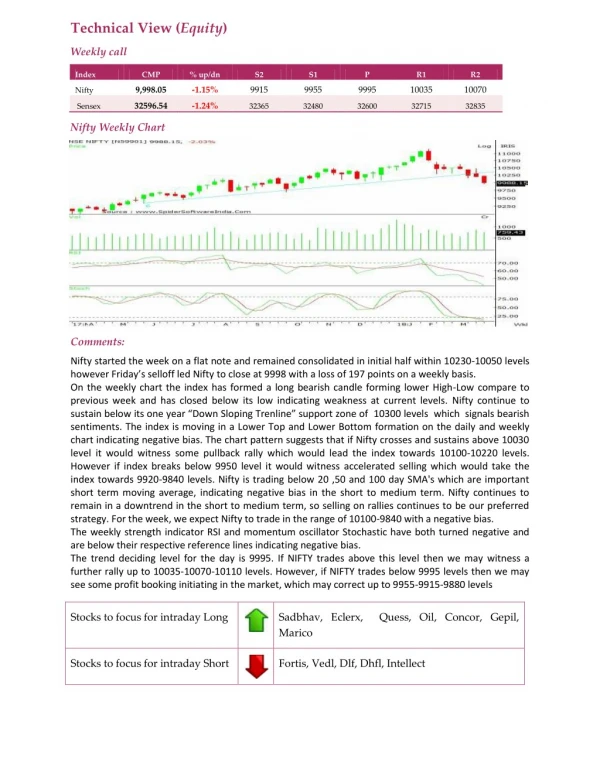
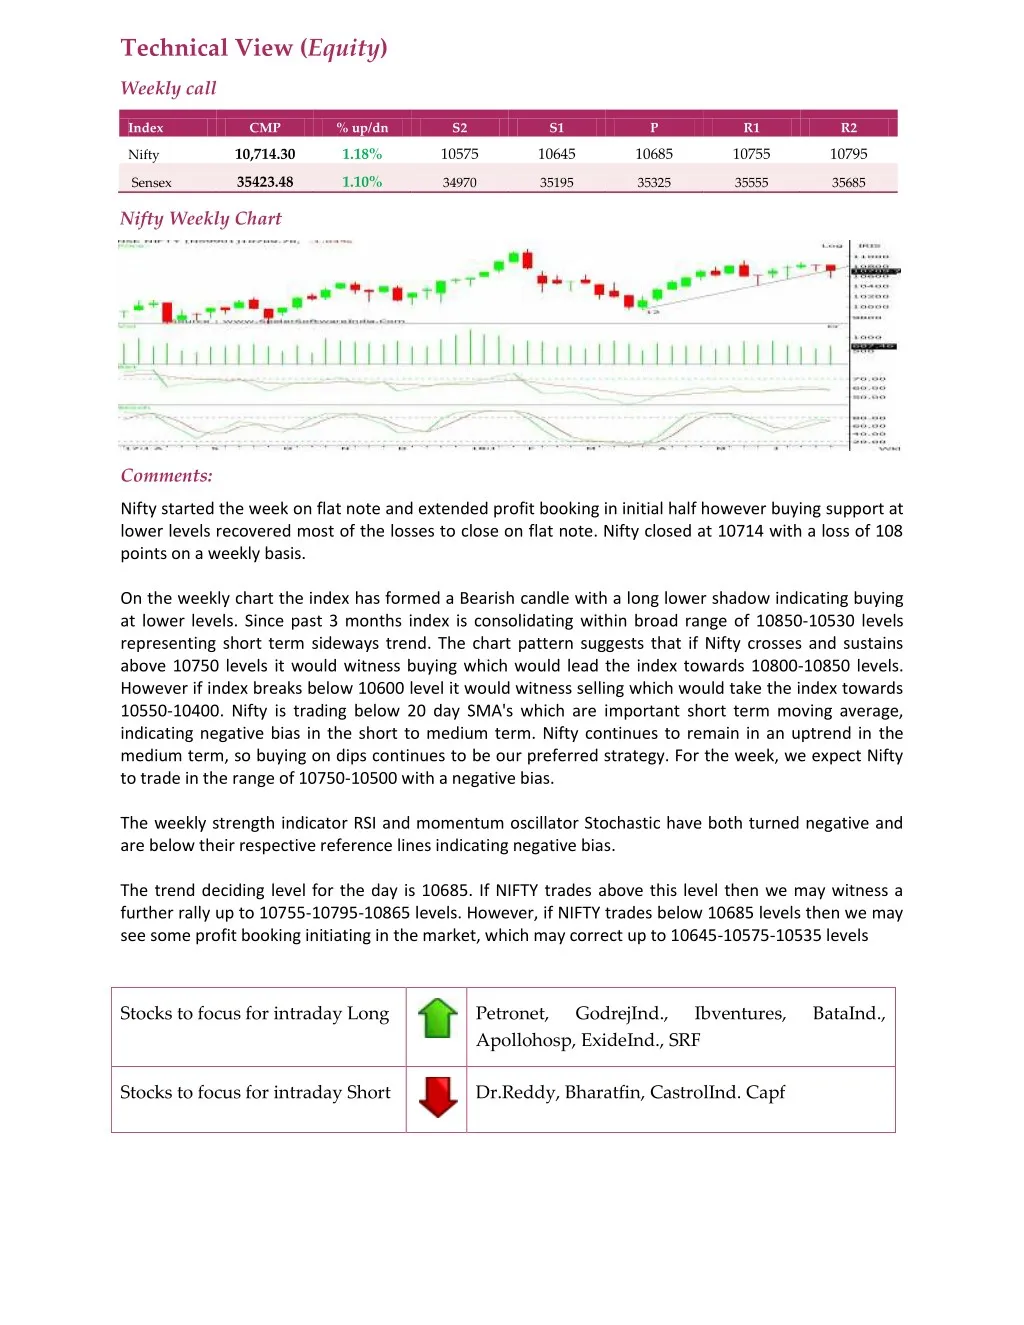
Technical View (Equity) Weekly call Index CMP % up/dn S2 S1 P R1 R2 10,714.30 1.18% 10575 10645 10685 10755 10795 Nifty 35423.48 1.10% Sensex 34970 35195 35325 35555 35685 Nifty Weekly Chart Comments: Nifty started the week on flat note and extended profit booking in initial half however buying support at lower levels recovered most of the losses to close on flat note. Nifty closed at 10714 with a loss of 108 points on a weekly basis. On the weekly chart the index has formed a Bearish candle with a long lower shadow indicating buying at lower levels. Since past 3 months index is consolidating within broad range of 10850-10530 levels representing short term sideways trend. The chart pattern suggests that if Nifty crosses and sustains above 10750 levels it would witness buying which would lead the index towards 10800-10850 levels. However if index breaks below 10600 level it would witness selling which would take the index towards 10550-10400. Nifty is trading below 20 day SMA's which are important short term moving average, indicating negative bias in the short to medium term. Nifty continues to remain in an uptrend in the medium term, so buying on dips continues to be our preferred strategy. For the week, we expect Nifty to trade in the range of 10750-10500 with a negative bias. The weekly strength indicator RSI and momentum oscillator Stochastic have both turned negative and are below their respective reference lines indicating negative bias. The trend deciding level for the day is 10685. If NIFTY trades above this level then we may witness a further rally up to 10755-10795-10865 levels. However, if NIFTY trades below 10685 levels then we may see some profit booking initiating in the market, which may correct up to 10645-10575-10535 levels Stocks to focus for intraday Long Petronet, Apollohosp, ExideInd., SRF GodrejInd., Ibventures, BataInd., Stocks to focus for intraday Short Dr.Reddy, Bharatfin, CastrolInd. Capf