Download
1 / 61
620 likes | 663 Views
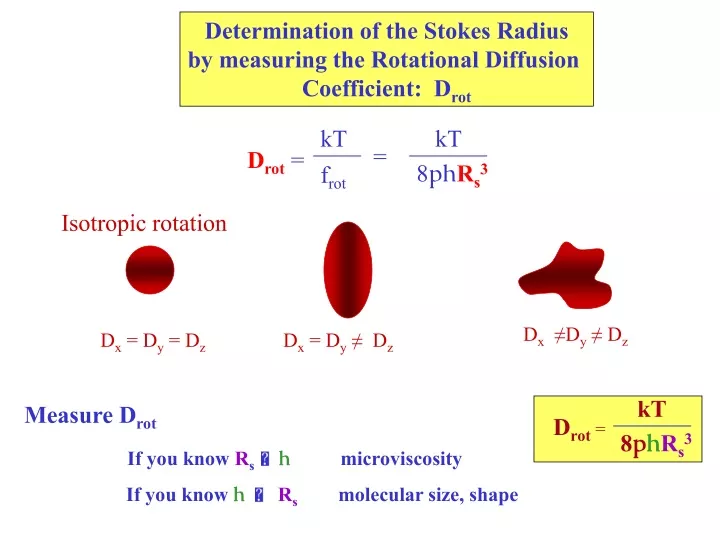
kT. kT. =. D rot =. 8 ph R s 3. f rot. Determination of the Stokes Radius by measuring the Rotational Diffusion Coefficient: D rot. Isotropic rotation. D x ≠D y ≠ D z. D x = D y = D z. D x = D y ≠ D z. kT. Measure D rot. D rot =. 8 p h R s 3.

E N D
kT kT = Drot = 8phRs3 frot Determination of the Stokes Radius by measuring the Rotational Diffusion Coefficient: Drot Isotropic rotation Dx ≠Dy ≠ Dz Dx = Dy = Dz Dx = Dy ≠ Dz kT Measure Drot Drot = 8phRs3 If you know Rs h microviscosity If you knowh Rsmolecular size, shape
Rotational Diffusion Rate can be determined by Fluorescence Spectroscopy Fluorescence polarization (anisotropy) can measure how rapidly a molecule is tumbling in solution sample excitation light t1 t2 I I fluorescent light
preferential excitation of molecules whose is parallel to the electric field vector of the excitation light Fluorescence anisotropy For polarized excitation light, the probability of absorption of a photon depends on cos2 Z q hu X Y After excitation non-random distribution Before (random)
Fluorescence anisotropy After formation of the excited state, the molecule can rotate during the time prior to photon emission Z orientation upon absorption q rot hu orientation at the time of emission X Y
z-component = x-component = y-component = Iz proportional to < cos2q > Average over population Ix proportional to < sin2q > < cos2w > IY proportional to < sin2q > < sin2w > Fluorescence polarization Z The probability of detecting the emitted photon depends on the orientation of the transition dipole moment of the excited state molecule AT THE TIME OF EMISSION and the orientation of the polarizer in the detection device q X IZ w Y IX probability of detecting the photon with polarization along the z-axis = ||2cos2q x-axis = (sinq cosw)2 y-axis = (sinq sinw)2
III - I III - I Define: polarization, P = anisotropy, A = III+I III+2I -1 2 1 1 A = - 3 P 3 Fluorescence polarization Z q Define I = IZ X III = IZ w If we start with excitation light polarized along the z-axis, then Ix = Iy = I Y IX = I The total light intensity at the detector is Itot = III + 2I
III - I < cos2q > - < cos2w > < sin2q > A = = III+2I < cos2q > + 2 < cos2w > < sin2q > 3 < cos2q > - 1 A = 2 Polarization Relate Anisotropy to < cos2q > Z ^ q Since we excite with light polarized along Z, we must have symmetry about this axis - so w will always be random => < cos2 w > = 1/2 X w Y By measuring IX and IZ we can compute < cos2q > for the emitting molecules
Eex Z m E q What goes into < cos2q > ? Photoselection I Probability of absorption cos2q The excited state population is not randomly oriented immediately after excitation m of excited state molecules Excitation beam After excitation non-random (III > I ) Before (random)
II Change in m for absorption + emission abs 2 em IC m01 m02 m01 m02 1 Fixed angle l hu2 hu1 0 Change m photoselection What goes into < cos2q > ?
III What goes into < cos2q > ? Rotational diffusion: Rotational diffusion coefficient Drot Rotate Change m photoselection rotation
Z Z q Step 1 m View each of these as a series of isotropic displacementsof the average direction of the transition dipole moment Z Z l qrot Step 3 Step 2 photoselection change m rotation Goal: Find average displacement () in terms of known parameters
3 < cos2q > - 1 3 < cos2aN > - 1 3 < cos2a1 > - 1 3 < cos2a2 > - 1 . ….. = 2 2 2 2 Z Z etc. a1 a2 Perrin’s equation: 3 < cos2q > - 1 3 < cos2q0 > - 1 3 < cos2l > - 1 3 < cos2qrot > - 1 . . = A = 2 2 2 2 1 Find this Measure this 2 3 Stokes radius |rot| Drot Use Soleillet’s equation - from geometry, describing a series of isotropic displacements of a vector
Z Z q Step 1 1 3 2 m Photoselection Photoselection: 3 < cos2q > - 1 3 < cos2q0 > - 1 3 < cos2l > - 1 3 < cos2qrot > - 1 . . = A = 2 2 2 2 Find this 1 Measure this Probability of absorption cos2q0 < cos2q0 > = 3/5 This is derived in the 346 Class Notes So A = 0.4 P = 0.5 Maximum values of Anisotropy and Polarization
2 m Emit from a different transition after internal conversion Change in : Large l Z Z 02 X X 01 Y Y 0.4 from photoselection 3 < cos2l > - 1 A0 = 0.4 2 A0 is the anisotropy obtained in the absence of molecular rotation - e.g., using frozen solutions or solutions with high viscosity Depends on excitation + emission wavelengths Maximum value for l = 90 so limits on A0 and P0 are -0.2 A0 0.4 -0.33 P0 0.5
3 < cos2qrot > - 1 A = A0 2 Rotational Diffusion: will always tend to bring A 0 or P 0 qrot Anisotropy of frozen sample < cos2qrot >= 1 if there is no rotation: A = Ao < cos2qrot >=1/3 for random orientation: A = 0
Rotational Diffusion: will always tend to bring A 0 or P 0 3 < cos2qrot > - 1 A = A0 3 < cos2q > - 1 3 < cos2dq > - 1 3 < cos2dq > - 1 3 < cos2dq > - 1 . ….. = 2 2 2 2 2 Z Z etc. dq dq 3 < cos2qrot > - 1 2 3 N = (1 - 6 Drotdt)t/dt Rotational Diffusion Ao value from photoselection plus change in Break down rotation into a series of N isotropic steps of size dq cos2dq = 1 - sin2dq 1 - dq2 For a small “step” Rotational Diffusion: < dq2 > = 4 Drotdt = 1 - 4 Drotdt
A = A0 e- 6 D t rot A 3 < cos2qrot > - 1 3 < cos2qrot > - 1 2 2 N = (1 - 6 Drotdt)t/dt = e- 6 D t rot Rotational Diffusion But (1-x) e-x for x << 1 Time-resolved Anisotropy yields Drot Calculate Drot Monitor anisotropy following a pulse of excitation light: time
f(t)dt t t Steady State Measurement of Fluorescence Anisotropy Fraction of photons emitted in (t, t+dt) = f(t)dt t+t t A(t) Average anisotropy A = A0 (1 + 6 Drott)-1 Perrin’s equation
substitute : V molecular volume 1 1 - P 3 Define: rotational diffusion time = Various forms of Perrin’s equation (1) (2) (3) Perrin plot (4) T h (5)
kT 8pRs3 Define: rotational diffusion time = Result for steady state fluorescence from a rotating molecule Fluorescence lifetime Measure this
H2N Protein Rotational Diffusion I. Extrinsic Probes + Dansyl chloride t = 14 nsec II. Results r0 = (3hV) / (kT) = (3hV2M) / (NkT) [(mol.wt) / 1.15] x 10-3 nsec find r (A0 / A) = 1 + (3t / r) Measure A0, A, t
Example: Fluorescence Anisotropy Measurement of Protein-Protein Interactions TATA-box Binding Protein (TBP) binds with high affinity to TBP-associated Factor subunit TAF130p 1. Label TBP with tetramethyl rhodamine at a reactive cysteine residue 2.To a solution of 100 nM TBP (labeled) titrate increasing amounts of TAF130p (0-255 nM) 3. Exitation at 540 nm; emission monitored at 575 nm Conclude: High affinity binding (Kd = 0.5 nM) Biological consequence: binding of TAF130p to TBP competes with DNA binding to TBP J. Biol. Chem., Vol. 276, Issue 52, 49100-49109, December 28, 2001
Fluorescence Anisotropy used to monitor Protein-DNA Interactions 1. 50 nM Rhodamine labeled DNA 2. Titrate TBP 3. Excitation at 580 nm/Emission at 630 nm SHOWS 1:1 COMPLEX 1. 1:1 DNA:TBP complex, with labeled DNA (50, 100, 250 nm TBP) 2. Titrate TAF130p SHOWS ELIMINATION OF TBP-DNA COMPLEX BY COMPETING TAF130p 1. 50 nm labeled DNA 2. Titrate with TAF130p SHOWS NO COMPLEX BETWEEN DNA AND TAF130p J. Biol. Chem., Vol. 276, Issue 52, 49100-49109, December 28, 2001
V molecular volume Fluorescence anisotropy used to measure microviscosity The rotational diffusion coefficient can be related to Molecular volume: V Measure this If you know V You can determine
Fluorescent Probes dissolved are used to measure Membrane microviscosity Diphenyl hexatriene (DPH) Perylene Hydrophobic probes: Probe dissolved in membrane bilayer • partition into membrane bilayer • do not bind to protein • rotation reports local viscosity Measure for specific probe Molecular constant: determine for probe in known viscosity (h) Then: A => h
Typically: for biological membranes h 1 Poise 100-times the viscosity of water Note: (1 / h)= fluidity of membrane
Typically: for biological membranes, h 1 Poise (~100X water viscosity) Note: (1 / h)= fluidity of membrane Two points: (1) Do not know where probe is located in the bilayer - maybe regions of differing fluidity. Where is probe? (2) Probes are not spherical. Hence, the specific model of how it moves will influence final interpretation
Example: The effect of deletion of the gene encoding -6-oleate desaturase in Arabidopsis thaliana Changes the fatty acid composition of the mitochondrial membrane: mostly oleic acid is present in the mutant (fad2) J. Biol. Chem., Vol. 276, Issue 8, 5788-5794, February 23, 2001
Membrane Fluidity monitored by the fluorescence Anisotropy of anthroyloxy fatty acid derivatives: the fluorophore is located at different depths in the membrane bilayer mutant wild-type mitochondrial membranes CONCLUDE: Decrease in unsaturation of the fatty acid components in the membrane results in increased anisoptropy, or increase in membrane viscosity Biological Consequence: decreased respiration and altered bioenergetics of the mitochondria Extracted lipids 2 18 depth in the membrane bilayer/position in fatty acid chain)
Fluorescence Polarization Example: Enolase dissociation + dimer 2 x 45,000 mol. wt. Can monitor dissociation: (1) Polarization of tryptophan emission (t = 4.5 nsec) (Due to changes in local motions) (2) Polarization of bound co-valent probe E.g. Dansyl (t = 14 nsec) => Probe can alter equilibrium constant!!!
+ D 2M Let C0 = total protein concentration as dimer [M]2 4C0 [a2 / (1 - a)] = K = [D] [M] [D] fM = fD = 2C0 C0 Where a = degree of dissociation [M] [M] a = = [M] + 2[D] 2C0 AD ID + AM IM Anisotropy: A = ID + IM from Monomer Fluorescence intensity from Dimer From A => a => K
Enolase: D 2M upon dilution monomer Dilute to 1.55 M (140 g/mL) Decrease in polarization from tryptophans : changes due to local structural changes that increase local motion of tryptophans PNAS (1982)79, 5268 -
Enolase: Pressure - Induced dissociation Biochemistry (1981)20, 2587 - Dansyl conjugate: [C0] = 5.6 mM + Favored at high pressure Lower molar volume due to more efficient packing of water at protein - interface region
Longer DNA double strand results in lower FRET (Energy Transfer) model DNA double helix as a cylinder
Fluorescence Anisotropy goes down when double strand helix “melts” to form single strand DNA Rhodomine-labeled DNA double strand single strand
DNA Melting Curves obtained from Fluorescence intensity measurements (longer DNA has steeper melting transition and higher Tm)
Salt induced conformational transition of the four-way DNA junction monitored by the Perrin Plot of rhodamine anisotropy Less compact: slower rotation larger molecular volume smaller slope in Perrin Plot More compact: faster rotation smaller molecular volume larger slope in Perrin Plot
Fluorescence Anisotropy used to study the Dynamics of a Transcription Initiation Complex Fos-Jun: transcription regulatory complex can bind to target palindromic DNA (AP-1 site) in either orientation NFAT1 protein: regulatory element that binds to Fos-Jun heterodimer only in one orientation on the DNA 180o rotation Question: Does Fos-Jun dissociate from the DNA and then re-bind when NFAT1 interacts with it? PNAS (2001) 98, 4893-4898
Fluorescence Anisotropy used to study the Dynamics of a Transcription Initiation Complex Label the DNA on both strands with 1) Cy3 and 2) Fluorescein Jun is labeled with Texas Red, which is a FRET acceptor from both Cy3 and Fluorescein Adding NFAT1 to the Complex causes the Fos-Jun protein to reverse its orientation on the DNA PNAS (2001) 98, 4893-4898
Binding of Fos-Jun to DNA site is primarily oriented with Texas Red label near Cy3 End of the DNA Emission spectra: excite fluorescein at 460 nm (solid lines) and Cy3 at 530 nm (dashed lines) FRET NO FRET PNAS (2001) 98, 4893-4898
Binding of NFAT1 to the Fos-Jun-DNA complex causes the 180o re-orientation of the protein The Texas Red label on Jun is now near the Fluorescein End of the DNA Emission spectra: excite fluorescein (solid lines) at 460 nm and Cy3 at 530 nm (dashed lines) PNAS (2001) 98, 4893-4898
Time-course of Fluorescence Changes shows rate of re-orientation of Fos-Jun complex after addition of NFAT1 PNAS (2001) 98, 4893-4898
Time-course of Fluorescence Anisotropy shows that binding of NFAT1 precedes reorientation of Fos-Jun complex fast binding to form complex with higher anisotropy due to larger size slow reorientaion fast binding slow re-orientation of the protein while remaining on the DNA monitored by FRET PNAS (2001) 98, 4893-4898
Probing DNA structure and dynamics Fluorescein (donor) and Rhodamine (acceptor) http://lfd.uiuc.edu/staff/gohlke/poster/#DNA junction
moi q E Rotational Diffusion Can model as a series of discontinuous jumps : <dq2> = 4Drotdt units of sec-1 start end The “orientation vector” for a molecule is provided by the transition moment dipole moi Optical experiments - Absorption + Fluorescence provide information about molecular orientation Probability of Absorption (or emission) cos2q
Rotational Diffusion moi q E Isotropic - for a sphere Dx = Dy = Dz 2 starting points 1 Discontinuous jumps : <dq2> = 4Drotdt units of sec-1 2 f(q, t) f(q,t) 2 Ficks 2nd law : Drot = t q2 f(q, t) = fraction of molecules oriented with m in angular interval (q, q + dq) q q + dq The “orientation vector” for a molecule is provided by the transition moment dipole moi Optical experiments - Absorption + Fluorescence provide information about molecular orientation Probability of Absorption (or emission) cos2q
Outer segment Disk membrane Rhodopsin The basis for measuring Drot is photoselection We can see how this works by reviewing transient absorption changes in the molecule rhodopsin that were used to determine the motion of this membrane protein Inner segment Nuclear region Synaptic region Axial view 60 mm Transverse view 11-cis retinal 5 mm
AX > 4 AZ AX = 1 AY Rhodopsin Retina provides oriented sample Z X Y Experiments ^ ^ ^ (1)Direct light (500 nm) along Y, polarized in X or Z directions Z X ^ ^ ^ (1)Direct light (500 nm) along Z, polarized in X or Y directions “random” Top view