Download

1 / 12
120 likes | 378 Views
R egression, Residuals, and Coefficient of Determination. Section 3.2. Regression Lines. Interpreting the Regression Line.

E N D
Regression, Residuals, and Coefficient of Determination Section 3.2
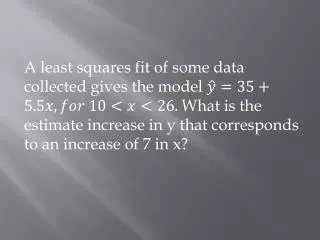
Interpreting the Regression Line • The slope b = .00344 tells us that fat gained goes down by .00344 kg for each added calorie of NEA according to this linear model. Our regression equation is the predicted RATE OF CHANGE in the response y as the explanatory variable x changes. • The y-intercept a = 3.505kg is the fat gain estimated by this model if NEA does not change when a person overeats.
Prediction • We can use a regression line to predict the response y for a specific value of the explanatory variable x.
Regression Line • In most cases, no line will pass exactly through all the points in a scatter plot and different people will draw different regression lines by eye. • Because we use the line to predict y from x, the prediction errors we make are errors in y, the vertical direction in the scatter plot • A good regression line makes the vertical distances of the points from the line as small as possible • Error: Observed response - predicted response
Least-Squares Regression Line(LSRL) • The least-squares regression line of y on x is the line that makes the sum of the squared vertical distances of the data points form the line as small as possible. • See Superhero Data in Fathom. • Create a Scatterplot of the Superhero data using your calculator. • Describe the direction, form, and strength. • Determine the LSRL. • Verify the slope using the formula b = r(Sy/Sx)
Residuals • A residual is the difference between an observed value of the response variable and the value predicted by the regression line. • Residual = observed y – predicted y • The error of our predictions, or vertical distance from predicted Y to observed Y, are called residuals because they are “left-over” variation in the response.
Residuals Example • Determine the residual value for Captain America. • Determine the residual value for The Black Widow.
Residual Plot • A residual plot is a scatterplot of the regression residuals against the explanatory variable. • Residual plots help assess how well a regression line fits the data. • The sum of the least-squares residuals is always zero. • The mean of the residuals is always zero, the horizontal line at zero in the figure helps orient us. This “residual = 0” line corresponds to the regression line. • Use your calculator to create a Residual Plot for the Superhero Data.
Examining a Residual Plot • Residual plot should show no obvious pattern. A curved pattern shows that the relationship is not linear and a straight line may not be the best model. • Residuals should be relatively small in size. A regression line in a model that fits the data well should come close” to most of the points.
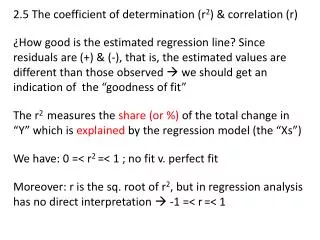
R squared- Coefficient of Determination • If all the points fall directly on the least-squares line, r-squared = 1. Then all the variation in y is explained by the linear relationship with x. • So, if r-squared = .606, that means that 61% of the variation in y among individual subjects is due to the influence of the other variable. The other 39% is “not explained”. • R-squared is a measure of how successful the regression was in explaining the response. • Interpret the r-squared value for the Superhero data.