Download
1 / 1
10 likes | 213 Views
Method for Determining Apparent Diffusion Coefficient Values for Cerebral Lesions from Diffusion Weighted Magnetic Resonance Imaging Examinations T.H. McDaniels, L.A.Ewell—Department of Radiation Oncology, University of Arizona

E N D
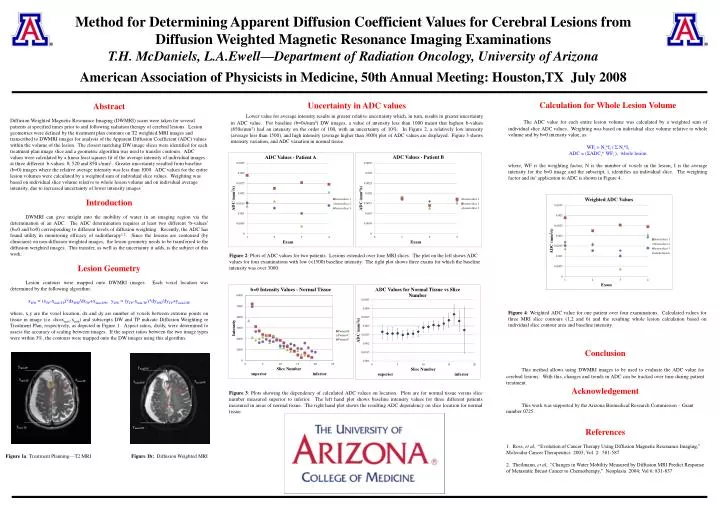
Method for Determining Apparent Diffusion Coefficient Values for Cerebral Lesions from Diffusion Weighted Magnetic Resonance Imaging Examinations T.H. McDaniels, L.A.Ewell—Department of Radiation Oncology, University of Arizona American Association of Physicists in Medicine, 50th Annual Meeting: Houston,TX July 2008 Calculation for Whole Lesion Volume The ADC value for each entire lesion volume was calculated by a weighted sum of individual slice ADC values. Weighting was based on individual slice volume relative to whole volume and by b=0 intensity value, as: WFi = Ni*Ii / Σ Ni*Ii ADC = (ΣADCi* WFi ), whole lesion where, WF is the weighting factor, N is the number of voxels in the lesion, I is the average intensity for the b=0 image and the subscript, i, identifies an individual slice. The weighting factor and its’ application to ADC is shown in Figure 4. Uncertainty in ADC values Lower value for average intensity results in greater relative uncertainty which, in turn, results in greater uncertainty in ADC value. For baseline (b=0s/mm2) DW images, a value of intensity less than 1000 meant that highest b-values (850s/mm2) had an intensity on the order of 100, with an uncertainty of 10%. In Figure 2, a relatively low intensity (average less than 1500), and high intensity (average higher than 3000) plot of ADC values are displayed. Figure 3 shows intensity variation, and ADC variation in normal tissue. Abstract Diffusion Weighted Magnetic Resonance Imaging (DWMRI) scans were taken for several patients at specified times prior to and following radiation therapy of cerebral lesions. Lesion geometries were defined by the treatment plan contours on T2 weighted MRI images and transcribed to DWMRI images for analysis of the Apparent Diffusion Coefficient (ADC) values within the volume of the lesion. The closest matching DW image slices were identified for each treatment plan image slice and a geometric algorithm was used to transfer contours. ADC values were calculated by a linear least squares fit of the average intensity of individual images at three different b-values: 0, 520 and 850 s/mm2. Greater uncertainty resulted from baseline (b=0) images where the relative average intensity was less than 1000. ADC values for the entire lesion volumes were calculated by a weighted sum of individual slice values. Weighting was based on individual slice volume relative to whole lesion volume and on individual average intensity, due to increased uncertainty of lower intensity images Introduction DWMRI can give insight into the mobility of water in an imaging region via the determination of an ADC. The ADC determination requires at least two different ‘b-values’ (b=0 and b>0) corresponding to different levels of diffusion weighting. Recently, the ADC has found utility in monitoring efficacy of radiotherapy1,2. Since the lesions are contoured (by clinicians) on non-diffusion weighted images, the lesion geometry needs to be transferred to the diffusion weighted images. This transfer, as well as the uncertainty it adds, is the subject of this work. Lesion Geometry Lesion contours were mapped onto DWMRI images. Each voxel location was determined by the following algorithm: xDW = (xTP-xmin,TP)*dxDW/dxTP+xmin,DW, yDW = (yTP-xmin,TP)*dyDW/dyTP+ymin,DW where, x,y are the voxel location, dx and dy are number of voxels between extreme points on tissue in image (i.e. dx=xmax-xmin) and subscripts DW and TP indicate Diffusion Weighting or Treatment Plan, respectively, as depicted in Figure 1. Aspect ratios, dx/dy, were determined to assess the accuracy of scaling between images. If the aspect ratios between the two image types were within 3%, the contours were mapped onto the DW images using this algorithm. Figure 2: Plots of ADC values for two patients. Lesions extended over four MRI slices. The plot on the left shows ADC values for four examinations with low (<1500) baseline intensity. The right plot shows three exams for which the baseline intensity was over 3000. Figure 4: Weighted ADC value for one patient over four examinations. Calculated values for three MRI slice contours (1,2 and 6) and the resulting whole lesion calculation based on individual slice contour area and baseline intensity. Conclusion This method allows using DWMRI images to be used to evaluate the ADC value for cerebral lesions. With this, changes and trends in ADC can be tracked over time during patient treatment. Acknowledgement This work was supported by the Arizona Biomedical Research Commission – Grant number 0725. References 1. Ross, et al, “Evolution of Cancer Therapy Using Diffusion Magnetic Resonance Imaging,” Molecular Cancer Therapeutics 2003; Vol. 2: 581-587 2. Theilmann, et al, “Changes in Water Mobility Measured by Diffusion MRI Predict Response of Metastatic Breast Cancer to Chemotherapy,” Neoplasia 2004; Vol 6: 831-837 Figure 3: Plots showing the dependency of calculated ADC values on location. Plots are for normal tissue versus slice number measured superior to inferior. The left hand plot shows baseline intensity values for three different patients measured in areas of normal tissue. The right hand plot shows the resulting ADC dependency on slice location for normal tissue. Figure 1a: Treatment Planning—T2 MRI Figure 1b: Diffusion Weighted MRI yminTP yminDW xminTP xmaxTP xmaxDW xminDW xTP xDW yTP yDW ymaxTP ymaxDW