Download
1 / 13
130 likes | 135 Views
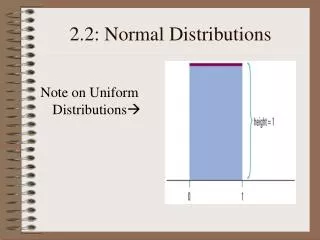
Standard Normal Calculations 2.2. Target Goal: I can standardize individual values and compare them using a common scale. Standardizing and Z-Scores. All normal curves are the same if we measure in units of size σ about the mean μ as center. Changing to these units is called standardizing .

E N D
Standard Normal Calculations2.2 Target Goal: I can standardize individual values and compare them using a common scale
Standardizing and Z-Scores All normal curves are the same if we measure in units of size σ about the mean μ as center. Changing to these units is called standardizing. • If x is an observation from a distribution that has mean μ and standard deviation σ, then the standardized value, called the z-scoreof x is:
Standardizing and Z-Scores A z-score tells us how many standard deviationsthe original observationfalls away from the meanand inwhich direction. • Observations larger than the mean are positive. • Observations smaller than the mean are negative.
Standard Normal Distribution • If a variable x has any normal dist. N(μ,σ), • Then the new standardized variable produced has the standard normal distribution. OriginalStandardizeNew x, N(μ,σ) z z, N(0,1)
Ex 1: Standardizing Women’s Heights • The heights of young women are approx. normal with μ = 64.5 inches and σ = 2.5 inches. • The standardized height is: z = (height – )/ A women’s standardized height is the number of standarddeviations by which her height differsfrom the mean height of all young women. 64.5 2.5
μ = 64.5 inches and σ = 2.5 64.5 2.5 • A women 68 inches has a standardized height ? z = ( – )/ = standard deviations above the mean. • A women 5 feet tall has a standardized height? standard deviations below the mean. 68 1.4 z = (60 – 64.5)/2.5 = -1.8
Standardizing • Standardizing gives a common scale and produces a new variable that has the standard normal distribution.
Normal Distribution Calculations • The area under a density curve is a proportion of the observations in a distribution. • After standardizing, all normal distributions are the same. • Table A gives areas under the curve for the standard normal distribution.
The table entry for each z value is the area under the curve to the left of z. • Be careful if the problem asks for the area to the left or to the right of the z value. • Always sketch the normal curve, mark the z value, and shade the area of interest.
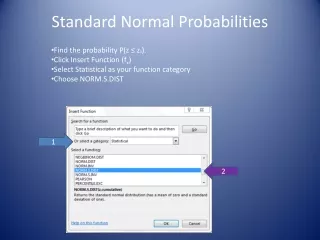
Ex. 3 Using the Z Table • Find the proportion of observations from the standard normal distribution that are less than 1.4. • Look in Table A to verify
Ex 1. Cont. Women’s Height • What proportion of all young women are less than 68 inches tall. (We already calculated z). • The area to the left of z = 1.4 under the standard normal curve is the same as the area to the left of x = 68. (Use Table A)
Finding Normal Proportions 1. State: the problemin terms of the observed variable x. Draw a picture of the distribution and shade the area of interest under the curve. 2. Plan:Standardize x and restate the problem in terms of a standard normal variable z. Draw a picture to show the area of interest under the standard normal curve. 3. DO: Find the required area under the standard normal curve, using Table Aand the fact that the total area under the curve is 1. 4. Conclude:Write your conclusion in the context of the problem.
Exercise 4: Table A Practice • Use Table A. In each case, sketch a standard normal curve and shade the area under the curve that is the answer to the question. a. z < 2.85 b. z > 2.85 c. z > -1.66 d. -1.66 < z < 2.85 .9978 1-.9978 = .0022 1 - .0485 = .9515 .9978 -.0485 = .9493