Download
1 / 2
250 likes | 1.25k Views
EMIS 5364/STAT 5344 Homework 11. X and S Charts. The following X and S Charts based on n = 4 have shown statistical control. Estimate the process parameters m and s . If the specifications are at 705 15, and the process output is normally distributed, estimate the fraction nonconforming.

E N D
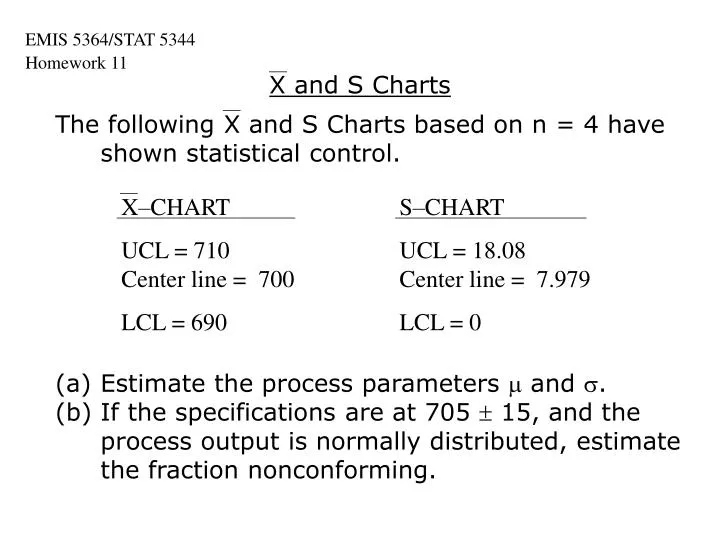
EMIS 5364/STAT 5344Homework 11 X and S Charts • The following X and S Charts based on n = 4 have shown statistical control. • Estimate the process parameters m and s. • If the specifications are at 705 15, and the process output is normally distributed, estimate the fraction nonconforming. X–CHART UCL = 710Center line = 700 LCL = 690 S–CHART UCL = 18.08Center line = 7.979 LCL = 0
EMIS 5364/STAT 5344Homework 11 X and S Charts (c) For the X–Chart, find the probability of type I error, assuming s constant. (d) Suppose the process mean shifts to 693 and the standard deviation simultaneously shifts to 12. Find the probability of detecting this on the X–Chart on the first subsequent sample.