Download

1 / 60
640 likes | 887 Views
Long-range Energy Alternatives Planning System. Charles Heaps, Ph.D. Stockholm Environment Institute www.energycommunity.org leap@sei-us.org SEI-U.S. Center 11 Curtis Avenue, Somerville MA, 02144, USA www.sei-us.org 11/06/2007.

E N D
Long-range Energy Alternatives Planning System Charles Heaps, Ph.D. Stockholm Environment Institute www.energycommunity.org leap@sei-us.org SEI-U.S. Center 11 Curtis Avenue, Somerville MA, 02144, USA www.sei-us.org 11/06/2007
SEI: an independent international research organization focusing on the issue of sustainable development. • Headquarters in Stockholm, Sweden with centers in the US, UK (York & Oxford), Estonia, and Bangkok. • About 150 staff: 17 in the U.S. • Funders include SIDA (Sweden), DGIS (the Netherlands), U.S. EPA, US-AID and US-DOE as well as UNEP, UNEP, the World Bank, and numerous foundations and national governments. • U.S. office is affiliated with Tufts University in Medford, MA. • Web: www.sei-us.org, www.sei.se, www.tufts.edu • Email: leap@sei-us.org
Model Typology • Optimization Models • Simulation Models • Accounting Frameworks
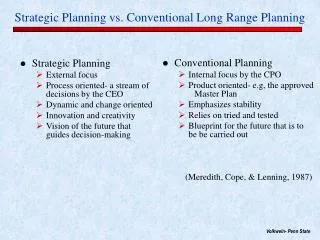
Top-down Use aggregated economic data Assess costs/benefits through impact on output, income, GDP Implicitly capture administrative, implementation and other costs. Assume efficient markets, and no “efficiency gap” Capture intersectoral feedbacks and interactions Commonly used to assess impact of carbon taxes and fiscal policies Not well suited for examining technology-specific policies. Models tend to be country-specific. Off-the-shelf software not typically available. Bottom-up Use detailed data on fuels, technologies and policies Assess costs/benefits of individual technologies and policies Can explicitly include administration and program costs Don’t assume efficient markets, overcoming market barriers can offer cost-effective energy savings Capture interactions among projects and policies Commonly used to assess costs and benefits of projects and programs Approaches for Energy Sector Analysis
Optimization Models • Identify least-cost energy systems based on constraints (e.g. a CO2 emissions target) • Select among technologies based on their relative costs. • “Dual” solution yields estimates of energy prices. • Assumes perfect competition & energy cost is only factor in technology choice. • Tend to yield extreme “knife edge” solutions. • Especially useful where many technical options need to be analyzed. • Data intensive (requires costs, hurdle rates, as well as energy data), complex opaque calculations • Examples: MARKAL/TIMES
Simulation Models • Simulates consumers & producer behavior under signals (e.g. prices, incomes, policies). • Finds market clearing demand-supply equilibrium. • Not limited by assumption of “optimal” behavior. • Does not assume energy cost is the only factor affecting technology choice • Behavioral relationships can be controversial and hard to parameterize. • Energy prices are endogenous. • Example: ENPEP
Accounting Frameworks • Rather than optimize behavior of a system, help user to account for implications of “what if” questions. • Primarily a physical instead of an economic model. • Main function is to manage data and results. • Flexible: do not rely on specific controversial economic models. • Rely on exogenous inputs: expert or stakeholder judgment, information from other models, etc.. • Low initial data requirements: transparent calculations. • Less suitable where technical issues are complex and a least-cost solution is needed. • Do not automatically yield price-consistent solutions (e.g. demand forecast may be inconsistent with projected supply configuration). • Example: LEAP
Long-range Energy Alternatives Planning System • An integrated energy-environment, scenario-based modeling system. • Based on relatively simple accounting and simulation modeling approaches. • Flexible data management structures encourage creation of disaggregated data structures. • Scope: demand, supply, resources, environmental loadings (emissions), cost-benefit analysis, non-energy sector emissions. • Methodology: Physical accounting for energy demand and supply via a variety of methodologies. Spreadsheet-like expressions for econometric and simulation modeling. • Specialized methodologies for modeling of certain sectors/issues. E.g. stock/turnover modeling for transport analyses. • Works well with other models: e.g. through links to spreadsheets. • Time-Frame: medium to long-term, annual time-step, unlimited number of years. • Data requirements: low initial data requirements. Many aspects optional. Start-out simple and add detail later. • Geographic Applicability: local, national, regional.
What Can You Do With LEAP? • Energy outlooks (forecasting) • Energy balances and environmental inventories. • Integrated resource planning. • Transport and device stock turnover models • Greenhouse gas mitigation analysis. • Strategic analyses of sustainable energy futures.
Selected LEAP Studies • APEC Energy Demand and Supply Outlook (2006) • China’s Sustainable Energy Future (2003) • America’s Energy Choices (1991) • Toward a Fossil Free Energy Future: The Next Energy Transition (1992) • Prospectiva Energetica de America Latina y el Caribe (2005) • Implementing Renewable Energy Options in South Africa (2007)
More LEAP Applications • USA: Greenhouse gas emissions mitigation in California, Washington, Oregon and Rhode Island. • Lawrence Berkeley Nat Labs: Constructing a global end-use oriented energy model. • Energy and Carbon Scenarios: Chinese Energy Research Institute (ERI) and LBNL. • Transport Energy Use and Emissions: Various U.S. transportation NGOs (UCS, ACEEE, SEI) and seven Asian Cities (AIT). • Greenhouse Gas Mitigation Studies: Numerous countries have selected LEAP for use in their next National Communications to the UNFCCC.APERC Energy Outlook: Energy forecasts for each APEC economy. • East Asia Energy Futures Project: Study of energy security issues in East Asian countries including the Koreas, China, Mongolia, Russia, Japan (lead by Nautilus Institute). • Integrated Resource Planning: Brazil, Malaysia, Indonesia, Ghana, South Africa. • Integrated Environmental Strategies: U.S. EPA initiative that engages developing countries in addressing both local environmental concerns and associated global greenhouse gas emissions. • City Level Energy Strategies: South Africa. • Sulfur Abatement Scenarios for China: Chinese EPA/UNEP. • More at: www.energycommunity.org
New in LEAP 2008… • Inter-regional trade calculations: so that import requirements for some regions (countries) will drive production and exports in other regions. • Ability to calculate and display comparative indicators across regions (rankings, scores, etc.) • Improved electric sector modeling • Improved results view. • National- and regional level “starter” data sets based on IEA data with historical data back to 1970 and IPCC Tier 1 GHG emissions, plus simple baseline projections (Coming early 2008).
Minimum Hardware & Software Requirements • Any modern Windows PC (2000, NT, XP, Vista). • 400 Mhz Pentium PC, 1024 x 768 screen resolution. • 128 MB RAM • Optional: Internet connection, Microsoft Office
Status and Dissemination • Available at no charge to non-profit, academic and governmental institutions based in developing countries. • Download fromwww.energycommunity.org • Technical support from web site or leap@sei-us.org • User name and password required to fully enable software. Available on completion of license agreement. • Most users will need training: available through SEI-Boston or regional partner organizations. • Check LEAP web site for news of training workshops.
View Bar • Analysis View: where you create data structures, enter data, and construct models and scenarios. • Results View: where you examine the outcomes of scenarios as charts and tables. • Diagram View: “Reference Energy System” diagram showing flows of energy in the area. • Energy Balance: standard table showing energy production/consumption in a particular year. • Summary View: cost-benefit comparisons of scenarios and other customized tabular reports. • Overviews: where you group together multiple “favorite” charts for presentation purposes. • TED: Technology and Environmental Database – technology characteristics, costs, and environmental impacts of apx. 1000 energy technologies. • Notes: where you document and reference your data and models.
The Tree • Main data structure used for organizing data and models, and reviewing results. • Each node in tree is called a “branch”. • Icons indicate types of data (e.g., categories, technologies, fuels and effects) • User edits data structures by editing the tree. • Supports standard editing functions (copy, paste, drag & drop branches)
Tree Branches • Category branches are used mainly for organizing the other branches into hierarchical data structures. • Technology branches are used to represent final energy consuming devices, and hence when choosing this type of branch you will also need to select the fuel consumed. The three basic demand analysis methodologies are represented by three different icons: • Activity Level Analysis, in which energy consumption is calculated as the product of an activity level and an annual energy intensity (energy use per unit of activity). • Stock Analysis, in which energy consumption is calculated by analyzing the current and projected future stocks of energy-using devices, and the annual energy intensity of each device. • Transport Analysis, in which energy consumption is calculated as the product of the number of vehicles, the annual average distance traveled per vehicle and the fuel economy of the vehicles. • Key Assumption branchesare used to indicate independent variables (demographic, macroeconomic, etc.) • In the Transformation tree, fuel branches indicate the feedstock, auxiliary and output fuels for each Transformation module. In the Resource tree, they indicate primary resources and secondary fuels produced, imported and exported in your area . • Effect branches indicate places where environmental loadings (emissions) are calculated.
Top-Level Tree Categories • Key Assumptions: independent variables (demographic, macroeconomic, etc.) • Demand: energy demand analysis (including transport analyses). • Statistical Differences: the differences between final consumption values and energy demands. • Transformation: analysis of energy conversion, extraction, transmission and distribution. Organized into different modules, processes and output fuels. • Stock Changes: the supply of primary energy from stocks. Negative values indicate an increase in stocks. • Resources: the availability of primary resources (indigenous and imports) including fossil reserves and renewable resources. • Non-energy sector effects: inventories and scenarios for non-energy related effects.
Modeling at Two levels • Basic physical accounting calculations handled internally within software (stock turnover, energy demand and supply, electric dispatch and capacity expansion, resource requirements, costing, pollutant emissions, etc.). • Additional modeling can be added by the user (e.g. user might specify market penetration as a function of prices, income level and policy variables). • Users can specify spreadsheet-like expressions that define data and models, describing how variables change over time in scenarios: • Expressions can range from simple numeric values to complex mathematical formulae. Each can make use of • math functions, • values of other variables, • functions for specifying how a variable changes over time, or • links to external spreadsheets.
Some Expression Examples • Simple Number • Calculates a constant value in all scenario years. • Simple Formula • Example: “0.1 * 5970” • Growth Rate • Example: “Growth(3.2%)” • Calculates exponential growth over time. • Interpolation Function • Example: “Interp(2000, 40, 2010, 65, 2020, 80)” • Calculates gradual change between data values • Step Function • Example: “Step(2000, 300, 2005, 500, 2020, 700)” • Calculates discrete changes in particular years • GrowthAs • Example: “GrowthAs(Income,elasticity) • Calculates future years using the base year value of the current branch and the rate of growth in another branch. • Many others!
Four Ways to Edit an Expression: • Type to directly edit the expression. • Select a common function from a selection box. • Use the Time-Series Wizard to enter time-series functions (Interp, Step, etc. and to link to Excel) • Use the Expression builder to make an expression by dragging-and-dropping functions and variables.
Scenarios in LEAP • Consistent story-lines of how an energy system might evolve over time. Can be used for policy assumption and sensitivity analysis. • Inheritance allows you to create hierarchies of scenarios that inherit default expressions from their parent scenario. All scenarios inherit from Current Accounts minimizing data entry and allowing common assumptions to be edited in one place. • Multiple inheritance allows scenarios to inherit expressions from more than one parent scenario. Allows combining of measures to create integrated scenarios. • The Scenario Manager is used to organize scenarios and specify inheritance. • Expressions are color coded to show which expressions have been entered explicitly in a scenario (blue), and which are inherited from a parent scenario (black) or from another region (purple).
Demand Modeling Capabilities • Flexible hierarchical tree data structure. • Can be used for: • Bottom-up end-use based modeling • Top-down econometric based modeling • Flexible/ad-hoc combinations of both • Three basic methodologies: • Final Energy Analysis (Activity Level * Final Energy Intensity) • Useful Energy Analysis (Activity Level * Useful Energy Intensity * Device Efficiency) • Full Stock-Turnover Modeling for Vehicles and Devices. • GHG and local air pollutant emissions tracking • Full tracking of demand-side costs.
Demand Modeling Methodologies • Final Energy Analysis: e = a i • Where e=energy demand, a=activity level, i=final energy intensity (energy consumed per unit of activity) • Example: energy demand in the cement industry can be projected based on tons of cement produced and energy used per ton. Each can change in the future. • Useful Energy Analysis: e = a (u / n) • Where u=useful energy intensity, n = efficiency • Example: energy demand in buildings will change in future as more buildings are constructed [+a]; incomes increase and so people heat and cool buildings more [+u]; or building insulation improves [-u]; or as people switch from less efficient oil boilers to electricity or natural gas [+n].
Demand Modeling Methodologies (2) • Transport Analysis: e = s m / fe • Where: s= number of vehicles (stock), m = vehicle distance, fe = fuel economy • Allows modeling of vehicle stock turnover. • Also allows pollutant emissions to be modeled as function of vehicle distance. • Example: model impact of new vehicle fuel economy or emissions standards.
Saturation and Share • Saturation: Similar to a market penetration. When using this unit all values must be between 0% and 100%, but neighboring values need NOT sum to 100%. For example, 100% of households may use and electric stove and 20% may also use a gas stove. • Share: Use this unit to tell LEAP that all immediately neighboring branches must sum to 100%. For example, the sum of urban and rural percentages should equal 100%. In calculations, if branches do not sum to 100% LEAP will halt the calculations and show an error message. • When there is only one branch either saturation or share can be used.
Transport Stock-Turnover Modeling • In earlier activity level analysis we were always dealing with the average characteristics of all vehicles on the road (averaged across new and old). • In a stock-turnover analysis we want to reflect the different characteristics of of vehicles of different ages (vintages). • Vehicle characteristics will change as vehicles get older (emissions profiles, km driven, fuel economy, etc.) • We also want to reflect how transport policies affecting new vehicles (e.g. new fuel economy standards and emissions standards) will have a gradual impact as older vehicles are retired and newer vehicles are purchased. So we need to model how long vehicles survive on the road. • New in 2007: ability to examine fuel switching and multi-fueled vehicles independently of transport stock turnover,
Transport Stock-Turnover Modeling Energy calculated as follows: e = s m / fe • Where: s= number of vehicles (stock), m = vehicle distance, fe = fuel economy • (NB: fuel economy can be defined as either l/100 km or MPG) • Emissions can be specified per unit of energy consumed or per unit of distance driven (which reflects how vehicle emissions are generally regulated).
Two Dynamics to Consider… Two dynamics to consider: • How characteristics of new vehicles might evolve (e.g. due to new regulations).These changes are specified from year to year using LEAP’s standard expressions (interp, growth, etc.) • How characteristics of existing vehicles change as they get older (so need to keep track of number of vehicles of each vintage).These changes are specified by vehicle age (vintage) from new to old (0, 1, 2, years, etc.) using a special lifecycle profile screen.
Lifecycle Profiles • Describe how vehicle characteristics change as they get older. • Used to describe: • Emissions degradation • Mileage degradation • Fuel economy degradation • Survival of vehicles • Typically start from value of 100% (the characteristic of a new vehicle). • Can be specified using data values, or an exponential curve or imported from Excel.
Transformation Modeling Capabilities • Flexible modeling of any transformation sector using 2 level module/process hierarchy (e.g. Electric Generation/Power Plants) • Models both capacity expansion and process dispatch. • Capacity expansion can be modeled exogenously or user can specify types and sizes of plants to be added and LEAP will add them endogenously to maintain a specified reserve margin. • Variety of methodologies available for modeling process dispatch ranging from simple process shares to full cost/merit order-based dispatch based on user-specified load duration curves. • Load curves can be exogenous or endogenous, based on shape of different demands. Endogenous modeling of load shape allows models to capture energy and capacity impacts of DSM and other structural shifts in demand. • Ability to model seasonal and time-of-day variations in loads and in merit order and availability of power plants. • Full simulation of imports and exports.
Electric Generation • Examines both Capacity Expansion (MW) and Plant Dispatch (MWh). • Exogenous Capacity: User specifies current and possible future capacity of plants (MW) • Endogenous Capacity: User specifies types of plants to be built but LEAP decides when to add plants to maintain a specified planning reserve margin. • Two Modes of Dispatch simulation: • Mode 1: Historical: LEAP simply dispatches plants based on historical generation. • Mode 2: Simulation: plants dispatched based on various dispatcxh rules ranging from very simple (% of total generation) to quite sophisticated (dispatch in order of running costs)
Electric Generation (2) • Plants are dispatched to meet both total demand (in MWh) as well as the instantaneous peak demand which varies from by hour, day and season. • User can exogenously specify a load-duration curve and LEAP will dispatch plants by merit order. • Alternatively, load shapes be specified for each demand device so that the overall system load is calculated endogenously. Thus the effect of DSM policies on the overall load shape can then be explored in scenarios. • Plant dispatch can also then be varied by season (e.g. to reflect how hydro dispatch may vary between wet and dry seasons).
Hourly Demand Curve • Hour-by-hour load curve • Power demand in each hour of the year • Area = Power (kW) x time (1 hour) = Energy (kWh)
Load Duration Curve • Rearrange hourly demand curve • Hours on x-axis is # of hours/year that demand is greater than or equal to a particular value
100 95 Peak Load Plants 90 85 80 75 70 65 Intermediate Load Plants Percent of Peak Load 60 55 50 45 40 35 30 BaseloadPlants 25 20 Capacity (MW) * MCF 15 10 5 0 0 500 1,000 1,500 2,000 2,500 3,000 3,500 4,000 4,500 5,000 5,500 6,000 6,500 7,000 7,500 8,000 8,500 Hours Sorted from Highest to Lowest Demand Load-Duration Curve and System Dispatch in LEAP
Simple Refinery Simulation Example • Output shares can be specified (as above) or calculated internally to be proportional to production requirements. • User sets rules for dealing with surpluses (export or waste) and for shortfalls (import or pass on to next module).
Costs in LEAP • Unlike in an optimization model, in LEAP cost information is not needed for the model to perform its basic energy calculations. • Cost information is optional and can be used to calculate the economic consequences of alternative scenarios.
Social Cost-Benefit Analysis in LEAP • Societal perspective of costs and benefits (i.e. economic not financial analysis). • Avoids double-counting by drawing consistent boundary around analysis (e.g. whole system including. • Cost-benefit analysis calculates the Net Present Value (NPV) of the differences in costs between two scenarios. • NPV sums all costs in all years of the study discounted to a common base year. • Optionally includes externality costs.
Simple Example of Cost-Benefit Analysis Two scenarios for meeting future growth in electricity lighting demand: • Base Case • Demand: future demand met by cheap incandescent bulbs. • Transformation: growth in demand met by new fossil fired generating capacity. • Alternative Case • Demand: DSM programs increase the penetration of efficient (but more expensive) fluorescent lighting. • Transformation: Slower growth in electricity consumption and investments to reduce transmission & distribution losses mean that less generating capacity is required.
Simple Cost-Benefit Analysis (cont.) • The Alternative Case… • …uses more expensive (but longer lived) lightbulbs. • Result: depends on costs, lifetimes, & discount rate. • …requires extra capital and O&M investment in the electricity transmission & distribution system. • Result: net cost • ..requires less generating plants to be constructed (less capital and O&M costs). • Result: net benefit • …requires less fossil fuel resources to be produced or imported. • Result: net benefit • …produces less emissions (less fuel combustion). • Result: net benefit (may not be valued)
Energy Balances An accounting system that describes the flows of energy through an economy, during a given period. Non-energy consumption (e.g. petrochemical feedstock, fertilizers) Transformation Sectors Losses and Consumption Imports Exports Total Final Energy Use in Consuming Sectors Total Primary Energy Produced Net Changes in Stocks