Download

1 / 33
330 likes | 356 Views
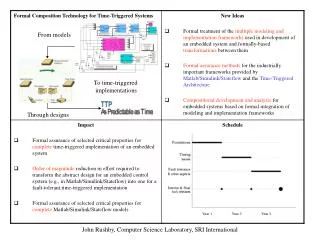
New insights from models. Anne Marie Treguier (LPO, Brest, France) Claus Böning (IFM Kiel, Germany). NCAR T-shirt design, 1988. … and today. POP global 1/10° model (Maltrud and McClean) 3600x2400x40 grid points. OCCAM global 1/12° model (Coward and Webb) 4320x1735x66 grid points.

E N D
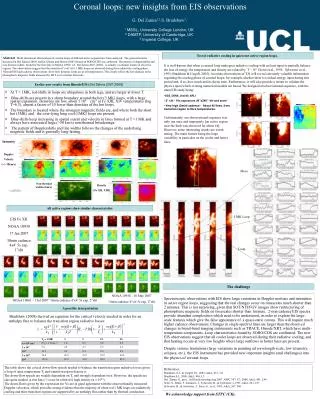
New insights from models Anne Marie Treguier (LPO, Brest, France) Claus Böning (IFM Kiel, Germany) NCAR T-shirt design, 1988
… and today POP global 1/10° model (Maltrud and McClean) 3600x2400x40 grid points. OCCAM global 1/12° model (Coward and Webb) 4320x1735x66 grid points Models yesterday... 1988: WOCE Community Model Experiment (Bryan et al) - North Atlantic, 1/3° - 220x242x30 grid points.
Plan 1 - Knowledge of the ocean circulation Discover and quantify Models/observations synergy Understand processes Sensitivity studies 2 - Mechanisms of heat transport variability Seasonal to interannual time scales: wind forcing Decadal scales : buoyancy fluxes come into play What about eddies? 3 - Perspectives
Discoveries: North Brazil Undercurrent The NBUC in the CME model (Schott and Böning, 1991). The NBUC with ADCP data (Stramma, Fisher, Reppin 1995)
Discovery of the North Queensland current R.D. Hughes, D. Webb NQc
Mean circulation, 350 m SPEM 1/3° model, coordinate (de Miranda et al., 1999) Marvor and Alace floats (Ollitrault, Davis...) The Zapiola Anticyclone in the Argentine Basin : An circulation driven by eddy-topography interactions Bottom Topography
AAIW SAMW Tasman leakage: a new route in the global conveyor belt 3 models, same behavior (Speich et al, 2002) MICOM Inverse model ORCA OCCAM
Plan 1 - Knowledge of the ocean circulation Discover and quantifyModel/observations synergy Understand processesSensitivity studies 2 - Mechanisms of heat transport variability Seasonal to interannual time scales Decadal scales What about eddies? 3 - Perspectives
The dynamical origin of the Azores current Azores current Strait of Gibraltar
The med outflow and the Azores current Jia, 1999: DYNAMO intercomparison project. With representation of med outflow: strong AZc Without representation of med outflow: weak Azc Ozgökmen et al, 2001: MICOM 1/12° model
Zonal current in the Brazil basin Float displacements: Hogg and Owens, 1999 1/6° CLIPPER Atlantic model, Treguier et al. 0.28° global POP model Maltrud et al. Displacements over 2 years at 2400m (North Atlantic Deep Water).
A possible dynamical origin of the zonal flows: wind forcing Nakano and Suginohara, 2002 Zonal flow in a shallow water model (20 modes) forced by a zonal wind Zonal flow at 140°W in a 1° model of the Pacific (bottom: contour interval 0.1 cm/s)
Dependency on model resolution Zonal velocity (mean over 10 years) at 2000m (westward in green. Contour interval 0.4 cm/s) 1° model 1/6° model
Zonal jets in the subtropical North Atlantic Mean zonal velocity (color) and mean velocity vectors at 1400m depth in 3 models
High resolution models improve our knowledge of the ocean circulation - Models begin to look like reality - High resolution basin scale models can be used to run sensitivity studies - Many key processes affecting the large scale circulation have very small scale
Plan 1 - Knowledge of the ocean circulation Discoveries and quantification Understanding processes 2 - Mechanisms of heat transport variability Seasonal to interannual time scales Decadal scales What about eddies? 3 - Perspectives
CMIP2 Heat transport and overturning Robust relationship at 25°N
Vertical overturning and horizontal gyres POP 1/10° North Atlantic model (Smith et al, 2000) Total heat transport overturning gyre
Robustness: DYNAMO models Böning et al, 2001 Ekman transport drives the seasonal variability in the Atlantic Böning and Hermann, 1994 Seasonal cycle at 25N: 0.2Pw = 3Sv Also at 6-8 days period: 2.5 Pw, 25 Sv
Seasonal variability of heat transport in the world ocean Jayne and Marotzke (2001) Total heat transport Ekman contribution
Strong negative correlation between Ekman velocity and SST Ekman transport and SAMW variability Rintoul and England, 2002 Variability of temperature and salinity at 45°S, 145°E (winter mixed layer) in a coupled model
Interannual variability of the meridional overturning at 45°N in the Atlantic Beismann et al, 2002 Amplitude: 3 Sv Robustness across models Link with the wind stress field.
Long time series of overturning at 48°N Eden and Jung,2002 Full forcing ---- NAO-related forcing heat flux only ---- all surface fluxes NAO forcing of the meridional overturning Time series of meridional heat transport at 48°N Eden and Willebrand,2002
Plan 1 - Knowledge of the ocean circulation Discover and quantify Understand processes 2 - Mechanisms of heat transport variability Seasonal to interannual time scales Decadal scales What about eddies? 3 - Perspectives
Eddies in the meridional heat transport 45°N: 20-25% 30°S: 20-25% Tropics: mean/eddy compensation
Eddy contribution at 30°S - The « classical » eddy flux v’h’ or v’T’: 20-25% of total no parameterization - Even when the « classical » eddy flux is zero, translating eddies have an effect : modification of mean flow properties.
Oceanic heat transport variability: model insights - Models reveal the importance of wind-forced variability: Ekman transport on seasonal scales Robustness at interannual scales - On decadal time scales, more complex processes importance of buoyancy fluxes - Even with models, the effect of eddies is difficult to quantify.
Future challenges • Model development: topography, parameterizations… • More horizontal resolution • More vertical resolution
Spatial resolution of models (1) Modelling the western boundary currents and deep reciculations. 1/6° model recirculation cell: 2Sv Currentmeter data: a recirculation of more than 20Sv? (Weatherly et al, 2000)
Spatial resolution of models (2) Anthropogenic CO2 flux in the subpolar North Atlantic (december 1989, in mol/m²/year). Arne Biastoch, 2002. 4/3° (100 km) FLAME model 1/3° (20 km) FLAME model Increased spatial resolution has a strong influence on the pattern of anthropogenic CO2 uptake in the North Atlantic subpolar gyre
Banks and Woods, 2001: Possible use of SAMW variability to detect climate change Models and climate change Bi et al, GRL, 2002: increase of the ACC transport in a transient warming scenario
What resolution in the oceanto model and predict anthropogenic climate change?