Download
1 / 1
10 likes | 118 Views
GEOLOGY OF CENTRAL APENNINES.

E N D
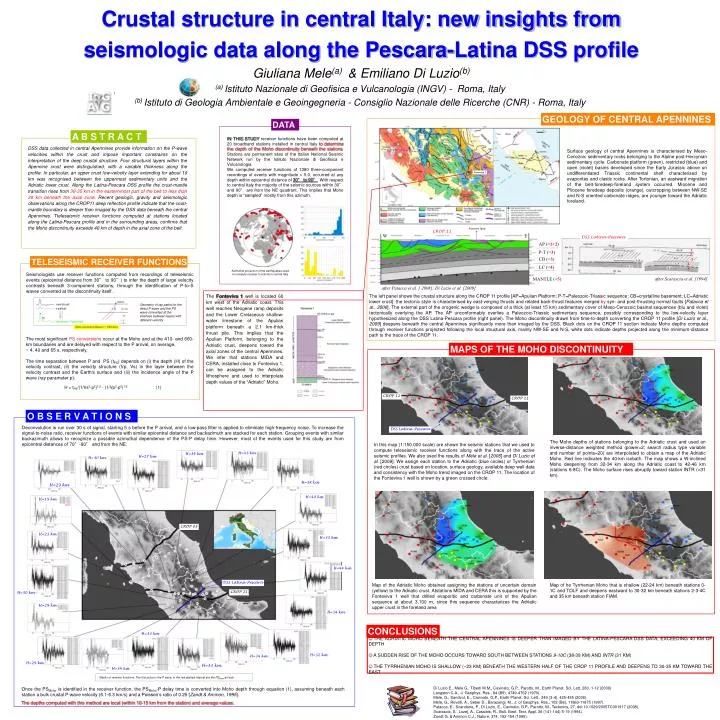
GEOLOGY OF CENTRAL APENNINES Surface geology of central Apennines is characterised by Meso-Cenozoic sedimentary rocks belonging to the Alpine post-Hercynian sedimentary cycle. Carbonate platform (green), restricted (blue) and open (violet) basins developed since the Early Jurassic above un undifferentiated Triassic continental shelf characterised by evaporites and clastic rocks. After Tortonian, an eastward migration of the belt-foredeep-foreland system occurred. Miocene and Pliocene foredeep deposits (orange), outcropping between NW-SE and N-S oriented carbonate ridges, are younger toward the Adriatic foreland. Fonteviva 1 W E AP (=1+2) Fonteviva 1(prj) CROP 11 P-T (=3) DSS Latina-Pescara CB (=3) 1 LC (=4) 2 3 MANTLE (=5) 4 Geometry of ray paths for the direct P wave and the PS wave converted at the interface between layers with different velocity 5 after Scarascia et al. [1994] after Patacca et al. [ 2008]; Di Luzio et al. [2009] (from epicentral distance > 3000 km) The left panel shows the crustal structure along the CROP 11 profile [AP=Apulian Platform; P-T=Paleozoic-Triassic sequence; CB=crystalline basement; LC=Adriatic lower crust]: the tectonic style is characterised by east-verging thrusts and related back-thrust features merged by syn- and post-thrusting normal faults [Patacca et al., 2008]. The external part of the orogenic wedge is composed of a thick (at least 15 km) sedimentary cover of Meso-Cenozoic basinal sequences (blu and violet) tectonically overlying the AP. The AP unconformably overlies a Paleozoic-Triassic sedimentary sequence, possibly corresponding to the low-velocity layer hypothesized along the DSS Latina-Pescara profile (right panel). The Moho discontinuity drawn from time-to-depth converting the CROP 11 profile [Di Luzio et al., 2009] deepens beneath the central Apennines significantly more than imaged by the DSS. Black dots on the CROP 11 section indicate Moho depths computed through receiver functions projected following the local structural axis, mainly NW-SE and N-S, white dots indicate depths projected along the minimum-distance path to the trace of the CROP 11. DATA A B S T R A C T IN THIS STUDY receiver functions have been computed at 20 broadband stations installed in central Italy to determine the depth of the Moho discontinuity beneath the stations. Stations are permanent sites of the Italian National Seismic Network run by the Istituto Nazionale di Geofisica e Vulcanologia. We computed receiver functions of 1380 three-component recordings of events with magnitude > 5.0, occurred at any depth within epicentral distance of 30° to 90°. With respect to central Italy the majority of the seismic sources within 30° and 90° are from the NE quadrant. This implies that Moho depth is “sampled” mostly from this azimuth. DSS data collected in central Apennines provide information on the P-wave velocities within the crust and impose important constraints on the interpretation of the deep crustal structure. Four structural layers within the Apennine crust were distinguished, with a variable thickness along the profile. In particular, an upper crust low-velocity layer extending for about 10 km was recognised between the uppermost sedimentary units and the Adriatic lower crust. Along the Latina-Pescara DSS profile the crust-mantle transition rises from 30-35 km in the easternmost part of the belt to less than 30 km beneath the axial zone. Recent geologic, gravity and seismologic observations along the CROP11 deep reflection profile indicate that the crust-mantle boundary is deeper than imaged by the DSS data beneath the central Apennines. Tteleseismic receiver functions computed at stations located along the Latina-Pescara profile and in the surrounding areas, confirms that the Moho discontinuity exceeds 40 km of depth in the axial zone of the belt. TELESEISMIC RECEIVER FUNCTIONS Azimuthal projection of the earthquakes used to compute receiver functions in central Italy Seismologists use receiver functions computed from recordings of teleseismic events (epicentral distance from 30° to 90°) to infer the depth of large velocity contrasts beneath 3-component stations, through the identification of P-to-S waves converted at the discontinuity itself. The Fonteviva 1 well is located 60 km west of the Adriatic coast. This well reaches Neogene ramp deposits and the Lower Cretaceous shallow-water limestone of the Apulian platform beneath a 2.1 km-thick thrust pile. This implies that the Apulian Platform, belonging to the Adriatic crust, deepens toward the axial zones of the central Apennines.We infer that stations MIDA and CERA, installed close to Fonteviva 1, can be assigned to the Adriatic lithosphere and used to interpolate depth values of the “Adriatic” Moho. The most significant PSconversions occur at the Moho and at the 410- and 660-km boundaries and are delayed with respect to the P arrival, on average, ~ 4, 40 and 65 s, respectively. The time separation between P and PS (tPS) depends on (i) the depth (H) of the velocity contrast, (ii) the velocity structure (Vp, Vs) in the layer between the velocity contrast and the Earth’s surface and (iii) the incidence angle of the P wave (ray parameter p): H = tPS/(1/Vs2-p2)1/2 - (1/Vp2-p2)1/2(1) MAPS OF THE MOHO DISCONTINUITY CROP 11 CROP 11 1C Crustal structure in central Italy: new insights from seismologic data along the Pescara-Latina DSS profile Giuliana Mele(a) & Emiliano Di Luzio(b) (a)Istituto Nazionale di Geofisica e Vulcanologia (INGV) - Roma, Italy (b)Istituto di Geologia Ambientale e Geoingegneria - Consiglio Nazionale delle Ricerche (CNR) - Roma, Italy O B S E R V A T I O N S Deconvolution is run over 30 s of signal, starting 5 s before the P arrival, and a low-pass filter is applied to eliminate high-frequency noise. To increase the signal-to-noise ratio, receiver functions of events with similar epicentral distance and backazimuth are stacked for each station. Grouping events with similar backazimuth allows to recognize a possible azimuthal dependence of the PS-P delay time. However, most of the events used for this study are from epicentral distances of 70°-90° and from the NE: DSS Latina-Pescara In this map (1:150.000 scale) are shown the seismic stations that we used to compute teleseismic receiver functions along with the trace of the active seismic profiles. We also used the results of Mele et al. [2006] and Di Luzio et al. [2009]. We assign each station to the Adriatic (blue circles) or Tyrrhenian (red circles) crust based on location, surface geology, available deep well data and consistency with the Moho trend imaged on the CROP 11. The location of the Fonteviva 1 well is shown by a green crossed circle. The Moho depths of stations belonging to the Adriatic crust and used an inverse-distance weighted method (power=2; search radius type variable and number of points=20) are interpolated to obtain a map of the Adriatic Moho. Red line indicates the 40-km isobath. The map shows a W-inclined Moho deepening from 32-34 km along the Adriatic coast to 42-46 km (stations 6-8C). The Moho surface rises abruptly toward station INTR (=31 km). H=43 km H=34 km H=27 km H=30 km H=38 km H=29 km H=40 km H=19 km CROP 03 H=23 km H=33 km H=44 km DSS Latina-Pescara Map of the Adriatic Moho obtained assigning the stations of uncertain domain (yellow) to the Adriatic crust. Atstations MIDA and CERA this is supported by the Fonteviva 1 well that drilled evaporitic and carbonate unit of the Apulian sequence at about 3,100 m, since this sequence characterizes the Adriatic upper crust in the foreland area Map of he Tyrrhenian Moho that is shallow (22-24 km) beneath stations 0-1C and TOLF and deepens eastward to 30-32 km beneath stations 2-3-4C and 35 km beneath station FIAM. CROP 11 H=30 km H=29 km H=34 km CONCLUSIONS H=33 km • THE ADRIATIC MOHO BENEATH THE CENTRAL APENNINES IS DEEPER THAN IMAGED BY THE LATINA-PESCARA DSS DATA, EXCEEDING 40 KM OF DEPTH • A SUDDEN RISE OF THE MOHO OCCURS TOWARD SOUTH BETWEEN STATIONS 9-10C (38-39 KM) AND INTR (31 KM) • THE TYRRHENIAN MOHO IS SHALLOW (~23 KM) BENEATH THE WESTERN HALF OF THE CROP 11 PROFILE AND DEEPENS TO 30-35 KM TOWARD THE EAST H=32 km H=34 km H=29 km H=33 km H=34 km Stacks of receiver functions. The first pulse is the P wave, in the red dashed interval are the PSMoho arrivals Di Luzio E., Mele G., Tiberti M.M., Cavinato, G.P., Parotto, M., Earth Planet. Sci. Lett, 280, 1-12 (2009) Langston C.A., J. Geophys. Res., 84 (B9), 4749-4762 (1979). Mele, G., Sandvol, E., Cavinato, G.P., Earth Planet. Sci. Lett., 249 (3-4), 425-435 (2006). Mele, G., Rovelli, A., Seber D., Barazangi, M., J. of Geophys. Res., 102 (B6), 11863-11875 (1997). Patacca, E., Scandone, P., Di Luzio, E., Cavinato, G.P., Parotto, M., Tectonics, 27, doi:10.1029/2005TC001917 (2008). Scarascia, S., Lozej, A., Cassinis, R., Boll. Geof. Teor. Appl. 36 (141-144) 5-19 (1994). Zandt G. & Ammon C.J., Nature, 374, 152-154 (1995). Once the PSMoho is identified in the receiver function, the PSMoho-P delay time is converted into Moho depth through equation (1), assuming beneath each station a bulk crustal P-wave velocity (6.1-6.3 km/s) and a Poisson’s ratio of 0.25 [Zandt & Ammon, 1995]. The depths computed with this method are local (within 10-15 km from the station) and average values.