Download
1 / 22
230 likes | 403 Views
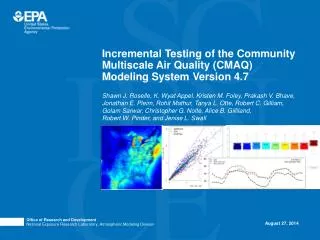
Assessing bi-directional ammonia transport using the Community Multi-Scale Air Quality (CMAQ) Model. Megan L. Gore and Viney P. Aneja Department of Marine, Earth & Atmospheric Sciences North Carolina State University Raleigh, NC, USA Ellen J. Cooter, Robin L. Dennis, and Jonathan E. Pleim

E N D
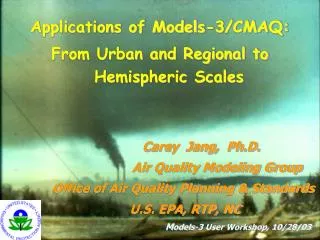
Assessing bi-directional ammonia transport using the Community Multi-Scale Air Quality (CMAQ) Model Megan L. Gore and Viney P. Aneja Department of Marine, Earth & Atmospheric Sciences North Carolina State University Raleigh, NC, USA Ellen J. Cooter, Robin L. Dennis, and Jonathan E. Pleim U.S. Environmental Protection Agency Research Triangle Park, NC, USA 8th Annual CMAS Conference, Chapel Hill, NCOctober 19-21, 2009 NC STATE UNIVERSITY
Outline • Introduction • Atmospheric Ammonia • Project Overview • Modeling Ammonia • Methods • Data • Emission Potential (gamma) • Results – Emissions • Current & Future Work • Limitations • Summary & Conclusions NC STATE UNIVERSITY
Atmospheric Ammonia • Impacts • Ecosystems: soil & water acidification, eutrophication, forest damage • Atmospheric: neutralization of sulfuric and nitric acid, leading to the formation of fine particulate matter (PM2.5) • Trends • Not federally regulated – fertilizer sales increasing; ammonia emissions projected to increase • Energy Independence and Security Act (EISA-RFS2) ~ 85% of total U.S. NH3 emissions are from agricultural sources ~ 35% of all agricultural NH3 emissions are from soils receiving commercial nitrogen fertilizer Source: (U.S. EPA, NEI 2002) NC STATE UNIVERSITY
Project Overview • Project Description • CMAQ bi-directional flux pilot study for the Eastern U.S. 2002 • Adjustment of current bi-directional flux module in CMAQ with the addition of a soil emission potential component • Soil emission potential calculated offline using commercial fertilizer survey data • Research Needs Addressed • Development and testing of methods of providing agricultural fertilizer information into CMAQ for full CONUS implementation in 2010 • Clarification of possible CMAQ ammonia and overall one-atmosphere chemical budget changes with the implementation of bi-directional flux option planned for the 2011 CMAQ release • Hypothesis/Expectations • Changes in emissions and fate for ammonia and other chemical species, particularly PM2.5, due to refinement of bi-directional flux in CMAQ NC STATE UNIVERSITY
Atmospheric Ammonia Modeling • Constant Emissions Inventory • Use of composite emission factors and agricultural activity to determine annual emissions • Large uncertainty in the magnitude of emission factors; fails to account for temporal and spatial variations • Process-Based • “bottom-up” emission estimates; based on most detailed spatial and temporal information available about emission sources and rates • limited by the quantity and spatial limitations of data • Inverse-Modeled • “top-down” emission estimates; regional and seasonal correction factors through successive model applications and comparison with observations of ambient concentration and wet deposition • susceptible to model input bias Next step…modeling bi-directional flux NC STATE UNIVERSITY
Ammonia Soil and Canopy Exchange Resistance to Deposition Capacitance for re-emission Canopy and underlying surfaces treated as an infinite chemical sink for atmospheric ammonia. Computes emission and deposition of ammonia via a temperature dependent parameterization of canopy and soil compensation point. Source: Cooter et al., 2009 NC STATE UNIVERSITY
Methods – Data • National Nutrient Loss & Soil Carbon Database (NNLSC) – crop mixes and temporal application profiles • Catalog of databases and tools to aid in evaluating relationships between agricultural practices and resulting impacts on carbon, nitrogen, and phosphorus fluxes over 298 million cropland acres (79% of total U.S.) • EPIC biophysical model 40-year runs based on 1997 data; outputs from 768,785 model runs are assigned a probability of occurrence based on management practices and environmental characteristics • Model inputs: nutrient management data from Cropping Practice Survey (CPS) and Area Studies (USDA-ERS), crop and management data from 1997 National Resource Inventory (NRI), soil data from Map Unit Interpretation Record, monthly climate statistics • Crops included: corn, soybeans, wheat, cotton, barley, sorghum, rice, potatoes, oats, peanuts, legume hay, and grass hay • 2002 Census of Agriculture – total crop acres by county • MCIP – meteorology for the standard 12km Eastern CMAQ domain NC STATE UNIVERSITY
EPIC Fertilizer Application and Emissions 40-year average of annual commercial fertilizer application rates for nitrogen in model simulations 40-year average of annual per-acre nitrogen lost to the atmosphere Source: NNLSC, 2006 NC STATE UNIVERSITY
Methods – Crop Mixes & Temporal Profiles • Identify sub-regions with relatively distinct crop mixes accounting for the majority of the fertilizer use by the magnitude of N application in each U.S. region (e.g. Southern Great Plains). • Compute a median annual N application rate for each crop in the sub-region. • Compute state temporal application profiles by determining the probability of an acre in that sub-region receiving a particular fertilizer application treatment (10 options, e.g. Fall, Spring and At Plant, etc.). If 1 application, application = median annual N rate; if 2 applications, assume 85/15 split. • Multiply time series of daily gammas by the fraction of sub-region acres in a state. Sum across all states in sub-region. The result is a single time series for each crop in the sub-region. • Multiply each weighted crop time series (# 4) by the fraction of total acres of that crop in the sub-region. Sum across all crops in sub-region. The result is a single time series of gammas for the sub-region. NC STATE UNIVERSITY
Methods – Calculating Emission Potential Dimensionless Emission Potential (Γg) [NH4+] is the ammonium ion concentration in the soil [H+] is the hydrogen ion concentration in the soil • Majority of [NH4+] contributing to the soil emission potential is from Biological Nitrogen Fixation (BNF) and the application of commercial fertilizers • [H+] is managed on an annual basis, but also varies on shorter time scales as a result of nitrification processes • Γg calculated via a box model constructed from EPIC algorithms representing the nitrification process • Box model inputs: physical properties of the ambient soil profile, meteorology, and crop management practices NC STATE UNIVERSITY
Results – Gamma Weighting Example Crop Mixes - Southern Great Plains Representative MCIP Weather Locations NC STATE UNIVERSITY
Results – Gamma Weighting Example Emission Potential, Γg (dimensionless) for dryland cotton. Variable meteorology across the sub-region is represented by 2 MCIP grid cells (46=solid, 50=dashed). All cotton acres in sub-region B are assumed to receive 31.5 kg/ha annual N fertilizer application. Application schedule is defined as: 0001=1 application on January 1, 1000=1 application 30 days prior to planting, 0010=1 application 30 days after planting and 0011=2 applications assumed to be 15% of annual on January 1 and 85% of annual 30 days after planting. NC STATE UNIVERSITY
Results – Gamma Weighting Example Step 4. Note scale reduction. Sub-region B crops and annual fertilizer application rates: irrigated corn (150.7 kg ha-1), dryland cotton (31.5 kg ha-1), irrigated cotton (76.4 kg ha-1), sorghum (93.2 kg ha-1), and winter wheat (44 kg ha-1). NC STATE UNIVERSITY
Results – Gamma Weighting Example Step 5. Note scale reduction. Daily gamma time series assigned to the 12 km grid cells that lie within sub-region B for direct input via IO/API file to CMAQ. NC STATE UNIVERSITY
Results – Gamma Weighting Example • Source Data • NEI emissions based on fertilizer sales and inverse modeling adjustments • Emission Potential based on crop and management practice surveys • Seasonal bi-modal emission peaks can be seen in both cases with variation in duration and time of year NC STATE UNIVERSITY
Gamma Implementation in CMAQ Xgis the compensation point-based NH3 concentration (ng m-3) A and B are Henry’s Law coefficient constants Tsis the soil temperature (K) Γg is the dimensionless NH3 emission potential (gamma) • Remove NEI fertilizer emissions data and input daily Γg per sub-region via IO/API file. • If the air concentration at the soil-air interface, C0.1, is less than Xg, NH3 will volatilize. • Ammonia flux calculated within CMAQ via bi-directional flux module. NC STATE UNIVERSITY
Current & Future Work • Modeling Phase • 1 month test case currently in progress to assess implementation procedures and ascertain any additional adjustments needed (e.g. soil moisture corrections, impacts of inverse modeling corrections, etc.) • Full 2002 year run over standard CMAQ 12km Eastern U.S. domain • Analysis of Model Output • Emissions - compare bi-directional flux to net (top of canopy) NEI emissions less deposition • Budget - compare bi-directional NH3 budget (dry deposition, wet deposition, transport) to base run, identifying any seasonal shifts or significant changes in magnitude, and possible implications • PM2.5 – indentify any potential temporal and/or spatial impacts on predicted PM2.5 formation NC STATE UNIVERSITY
Limitations & Assumptions • NNLSC Database • Only partial crop representation • Assumes no change over 40 year time span • Does not account for double cropping • Crop Mixes and Temporal Application Profiles • Assume uniform crop mix over entire sub-region • Assume median N application rate • Irrigated crops only broken out for corn and winter wheat on a case-by-case basis • Split time applications assumed to be 85/15 • Emission Potential Calculation • Representative MCIP meteorology grid cell for entire sub-region • Assume all fertilizer was applied to the surface (maximum value) • Assume uniform soil type • Daily gammas do not account for daytime rainfall events NC STATE UNIVERSITY
Summary & Conclusions • Soil Emission Potential for Commercial Fertilizer Application • Identify regions of similar crop mixes based on percentage of nitrogen applied from commercial fertilizer • Calculate daily Γg time series for each sub-region and apply appropriate weights for crop and temporal application profiles • CMAQ Modeling with Bi-directional NH3 Flux • Full year CMAQ model run over the Eastern U.S. using the 2002 NEI with fertilizer emissions removed and Γg input via IO/API file • Compare model outputs for emissions, concentration, and deposition to base 2002 model run • Hypotheses / Expectations • Shifts in magnitude and seasonality of NH3 emissions & subsequent atmospheric concentration • Increase in wet deposition and decrease in dry deposition NC STATE UNIVERSITY
Acknowledgements • National Research Council (NRC) • U.S. Environmental Protection Agency (EPA) • Steven R. Potter, Blackland Research Center, Temple, TX • NCSU Air Quality Research Group NC STATE UNIVERSITY
References Anderson, N., R. Strader, and C. Davidson, 2003. Airborne reduced nitrogen: ammonia emissions from agriculture and other sources, Environment International, 29:276-286, doi:10.1016/S0160-4120(02)00186-1. Cooter, E.J., J.O. Bash, J.T. Walker, M.R. Jones, and W. Robarge, 2009. Estimation of NH3 Bi-Directional Flux from Managed Agricultural Soils. In review. Gilliland, A.B., R.L. Dennis, S.J. Roselle, and T.E. Pierce, 2003. Seasonal NH3 emission estimates for the eastern United States based on ammonium wet concentrations and an inverse modeling method, J. Geophys. Res., 108, doi:10.1029/2002JD003063. Gilliland, A.B., K.W. Appel, R.W. Pinder, and R.L. Dennis, 2006. Seasonal NH3 emissions for the continental United States: Inverse model estimation and evaluation, Atmos. Environ., 40:4986-4998, doi:10.1016/j.atmosenv.2005.12.066. Pinder, R.W., P.J. Adams, S.N. Pandis, and A.B. Gilliland, 2006. Temporally resolved ammonia emission inventories: Current estimates, evaluation tools, and measurement needs, J. Geophys. Res., 111, D16310, doi:10.1029/2005JD006603. Potter, S.R., Andrews, S., Atwood, J.D., Kellogg, R.L., Lemunyon, J., Norfleet, L., and Oman, D., 2006. Model Simulation of Soil Loss, Nutrient Loss, and Change in Soil Organic Carbon Associated with Crop Production. Natural Resources Conversation Service, U.S. Department of Agriculture, Conservation Effects Assessment Project (CEAP), Government Printing Office, Washington, D.C., p. 235 pp. NC STATE UNIVERSITY
Assessing bi-directional ammonia transport using the Community Multi-Scale Air Quality (CMAQ) Model Megan L. Gore and Viney P. Aneja Department of Marine, Earth & Atmospheric Sciences North Carolina State University Raleigh, NC, USA Ellen J. Cooter, Robin L. Dennis, and Jonathan E. Pleim U.S. Environmental Protection Agency Research Triangle Park, NC, USA 8th Annual CMAS Conference, Chapel Hill, NC October 19-21, 2009 NC STATE UNIVERSITY