Download
1 / 23
230 likes | 323 Views
Studying present day and future air quality in California using WRF, CMAQ and satellite data. Greg Osterman 1,3 Jinwon Kim 2,3 Annmarie Eldering 1,3 Yunsoo Choi 1 1 Jet Propulsion Laboratory/California Institute of Technology 2 University of California, Los Angeles

E N D
Studying present day and future air quality in California using WRF, CMAQ and satellite data Greg Osterman1,3 Jinwon Kim2,3 Annmarie Eldering1,3 Yunsoo Choi1 1 Jet Propulsion Laboratory/California Institute of Technology 2University of California, Los Angeles 3UCLA Joint Institute for Regional Earth System Science and Engineering (JIFRESSE)
Project Goals • Construct a coupled regional climate and air quality modeling system • Part of a larger joint JPL/UCLA effort to build coupled models to study effects of climate change on California environmental issues (air quality, water resources, snow cover) • Study the potential effects of anthropogenic climate change on air quality in the mid-21st century • Do this by running the model for current time periods and future time periods using projected meteorological conditions from climate models • Focus on the changes in meteorological values have on ozone in 2044 (no emissions changes). • Evaluate the present day model results using meteorological analysis results, surface monitor and satellite data
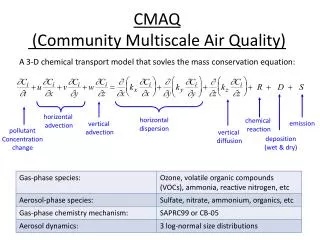
Model Description • Study focuses on July 2006 • WRF model is used to compute met fields (initiated by NCEP Reanalysis) • SMOKE is used to determine emission data • CMAQ is used for air quality simulations • Models are one way nested • Climate change signal by dynamically downscaling results from NCAR-CCSM3 (SRES-A1B) using the WRF model • Two time periods calculated: 2004-2008, 2040-2044 • Monthly mean differences in temperature and specific humidity are calculated from those time periods • Climate change signal in temperature and specific humidity is the added to the WRF results from July 2006 • CMAQ is run for July 2044
Model Calculation Scheme NCEP Reanalysis July 2006 Early 21st century Met data SMOKE EPA NEI2002 Emissions Present-day Emission data Compute the climate change signals between the Early- and mid-21st century Air Quality Data: Early 21st century and Mid-21st century for the changes in U, V, T, Q, HPBL T, Q T Q U, V, HPBL NCAR-CCSM3 Simulation with the IPCC SRES-A1B emissions profiles For July: Control Climate: 2004-2008 Mid-21st Century: 2040-2044 Air quality Sensitivity corresponding to the changes in the met fields Mid- 21st century Met data: Early 21 century + Climate change for U, V, T, Q, HPBL CMAQ Model Air Quality Simulations Met data preparation for the early 21C and mid-21C periods Air quality simulations for the early 21C and mid-21C periods
Evaluation: WRF over CA for July 2006 Evaluation using NCEP North American Reanalysis (NARR) with 30 km resolution Monthly mean 2m temperature with 12 km resolution from WRF Model tends to underestimate temperatures in most of CA, particularly the central valley High biases along the coast possibly due to difference in resolution in the models
Evaluation of CMAQ: TES Tropospheric O3 TES nadir footprint is 5 x 8 km Global Survey footprints 180 km apart Every 2 days… ~767 and counting Step & Stare footprints 45 km apart Special observation Transect footprints 12 km apart Special observation
Evaluation: TES Tropospheric O3 Must take into account vertical sensitivity of TES measurements when comparing profiles to the model
Evaluation: TES Tropospheric O3 • Looked at mean of TES profiles for July in three areas: • Northern CA/NV and Southern Oregon • Southern CA Desert • Pacific off CA Coast
Evaluation: Northern California TES shows reasonable comparison with model throughout the troposphere Surface monitor data higher than CMAQ for month at Lassen and Yreka
Evaluation: Southern California Desert TES shows higher tropospheric ozone than the model in the lower troposphere (15-20 ppb) Good comparison in the upper troposphere Surface monitor data higher than CMAQ for month at Death Valley, Palm Springs and Joshua Tree
Evaluation: Ocean • TES Step & Stare observation July 18, 2006 • TES data used with models can provide information on transport of data across the Pacific
Evaluation: Ocean • TES shows lower tropospheric ozone than the model in the lower troposphere (5-15 ppb) • Good comparison in the upper troposphere
Changes in Temperature and Humidity 2 m RH (%) 2 m Qv (g/kg) 2 m Temperature (K) 12 UT 06 UT 12 UT 12 UT 06 UT 06 UT 18 UT 00 UT 18 UT 00 UT 18 UT 00 UT Good statistical significance found in temperature and humidity but not in other meteorological variable (winds, PBL heights) Focus primarily on changes in 2 m temperature and humidity Significant warming and drier air over the Sierra Nevada and Western Nevada
Effects on O3 of Changes in all Meteorological Variables 12 UT 06 UT 00 UT 18 UT Adding effects of changes in winds and PBL lead to larger changes in ozone Largest effects concentrated in more populated regions Keeping ozone within EPA standards could be more difficult under warmer surface conditions Looking at the effects of changes in individual meteorological variables show results can be nonlinear
Conclusions • WRF/CMAQ model run for July 2006: • Reasonable comparison in free troposphere with mean TES ozone in Northern CA • Model sees lower mean ozone compared to TES in the lower troposphere over desert scenes in Southern California • Model compares well with TES in the upper troposphere over the ocean but is higher than TES in the lower troposphere • Climate run of WRF/CMAQ: • Statistically significant warming and drier air over the Sierra Nevada and Western Nevada • Increases in surface ozone seen over large parts of CA, particularly heavily populated regions • Increases in surface ozone due to temperature increases offset somewhat by changes in humidity.
Future Work • Further evaluation of the July 2006 control run using satellite and surface data: • TES CO • OMI NO2 and OMI/MLS tropospheric O3 residual • Comparison with GEOS-Chem assimilation of TES data • Better understanding of the reasons for the changes suggested by the model for the middle 21st century • Put results into context of other similar studies on future climate/air quality over CA and West coast
Effects on O3 of T and Q Changes Changes in O3 in ppm – July 2040 Mean Surface O3 in ppm – July 2006 12 UT 06 UT Mean 00 UT Mean 12 UT 00 UT 18 UT Sigma 00 UT Sigma 12 UT