Download
1 / 28
290 likes | 429 Views
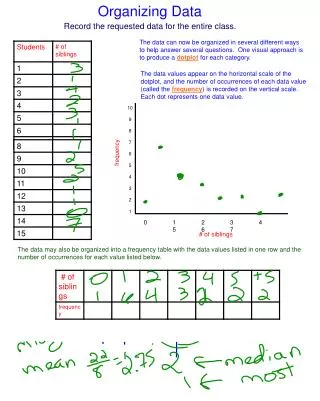
Organizing Data. Raw Data. Data collected in its original form. Suppose a researcher wants to do a study on the number of miles that employees of Wal-Mart travel each day. She collects the following data: (see data set 1). Frequency Distribution.

E N D
Raw Data • Data collected in its original form
Suppose a researcher wants to do a study on the number of miles that employees of Wal-Mart travel each day. She collects the following data: (see data set 1)
Frequency Distribution • The organization of raw data in table form, using classes and frequencies • Class – a subset of the data • Frequency – number of times in a class • Class limit – beginning and end of a class
Class limits Tally Frequency 1-3 4-6 7-9 10-12 13-15 16-18
Class limits Tally Frequency 1-3 ////’////’ 10 4-6 ////’////’//// 14 7-9 ////’////’ 10 10-12 ////’/ 6 13-15 ////’ 5 16-18 ////’ 5
Categorical Frequency Dist. • Used when data can be placed in specific categories, such as nominal or ordinal data. For example, political affiliation, religion, class…
See Data set 2 • Twenty five army inductees were given a blood test to determine their blood type. Data set 2 is the result. • Create a frequency distribution for the data.
Class Tally Frequency Percent A B O AB
Class Tally Frequency Percent A ////’ 5 20 B ////’// 7 28 O ////’//// 9 36 AB //// 4 16
Grouped Frequency Dist. • Used when data is continuous. • For example, the number of hours that boat batteries last (See Data set 3)
Class Class Cum. Limit Boundary Tally Freq. Freq. 24-30 23.5-30.5 /// 3 3 31-37 30.5-37.5 / 1 4 38-44 37.5-44.5 ////’ 5 9 45-51 44.5-51.5 ////’//// 9 18 52-58 51.5-58.5 ////’/ 6 24 59-65 58.5-65.5 / 1 25
Class Class Cum. Limit Boundary Tally Freq. Freq. 24-30 23.5-30.5 /// 3 3 31-37 30.5-37.5 / 1 4 38-44 37.5-44.5 ////’ 5 9 45-51 44.5-51.5 ////’//// 9 18 52-58 51.5-58.5 ////’/ 6 24 59-65 58.5-65.5 / 1 25
Class Limits • Each limit is the same size
Class Class Cum. Limit Boundary Tally Freq. Freq. 24-30 23.5-30.5 /// 3 3 31-37 30.5-37.5 / 1 4 38-44 37.5-44.5 ////’ 5 9 45-51 44.5-51.5 ////’//// 9 18 52-58 51.5-58.5 ////’/ 6 24 59-65 58.5-65.5 / 1 25
Class Boundary • Used to close the gaps in the frequency distribution. • Class limits should have the same decimal place as the raw data, and class boundaries should have one additional decimal place and end in a 5
Class Class Cum. Limit Boundary Tally Freq. Freq. 24-30 23.5-30.5 /// 3 3 31-37 30.5-37.5 / 1 4 38-44 37.5-44.5 ////’ 5 9 45-51 44.5-51.5 ////’//// 9 18 52-58 51.5-58.5 ////’/ 6 24 59-65 58.5-65.5 / 1 25
Cumulative Frequency • Used when you want to know how much data falls into 2 or more classes.
Between 5 and 20 classes • No hard and fast rule, but should give a clear description of the collected data
Class width should be an odd number • This ensures that the midpoint of the class has the same decimal place value as the data • Not always rigorously followed, especially when computers are used to group data
Class must be mutually exclusive • No overlapping class limits. • For example: Age 10-20, 20-30, etc. If you are 20, which group do you belong to?
The classes must be continous • If there are no values in a class, the class must be included in the distribution. The only exception is if the first class has zero frequency or if the last class has zero frequency.
The classes must be exhaustive • There should be enough classes to accommodate all the data.
The classes must be equal in width • This avoids distorting the view of the data. • One exception: Open-ended distributions. For example, age. 10-20, 20-30, 30-40, 40-50, over 50
Data Set 4 represents the record high temperatures for each of the 50 states. • Data Set 5 represents the number of miles per gallon that 30 selected SUV’s obtained in city driving.
Assignment • Create a frequency distribution for data set 4 using 7 classes and for data set 5 using 8. Include: class limits, class boundaries, tallies, frequency, and cumulative frequency in your tables.