Download
1 / 12
120 likes | 212 Views
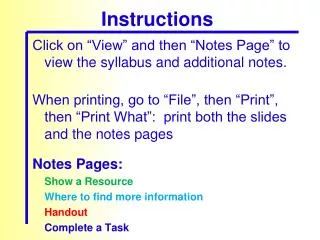
Notes: Organizing Data. I. Tables : used to arrange data in a way that makes it easier for you to compare all the information. The table itself is divided into columns and rows. Columns have a title that describes what is listed in that column.

E N D
Notes: Organizing Data • I. Tables: used to arrange data in a way that makes it easier for you to compare all the information. The table itself is divided into columns and rows. • Columns have a title that describes what is listed in that column. • Each row of items being compared in the table has a heading that describes specific characteristics.
Example: • Biologists studying a plot of plant in a hardwood forest. • Table 1 summarizes the biologist’s findings. • In Table 2, reorganize the same data to show information in descending order (highest to lowest).
II. Graphing • After scientists organize data in tables, they often then display the data in a graphic format (labeled as a figure). Graphs can be powerful tools for examining cycles and trends. The three main types are circle graphs, line graphs and bar graphs.
A. Circle Graph- sometimes called a pie chart, shows different parts of the data in relation to all of the data. Each section of the circle represents a different part of the data. • All sections equal 100 % when placed together.
The data from Table 1 and 2 were used to construct the following circle graph:
Important Characteristics of a circle graph: • 1. The pie sections of accurately drawn. • 2. The sections are clearly labeled. • 3. Labels, colors or shading are used to represent the different sections of the circle.
B. Line Graph- shows the relationship between two variables. • Independent Variable- placed on the x-axis (horizontal axis) • Dependent Variable- placed on the y-axis. (vertical axis) • Key- must be used if you want to compare two or more sets of data, multiple lines. This distinguishes one set of data from the other. • Title- tells what the graph is about and should be a concise statement. • Units- the scale on both the x and y-axis usually begin with zero (some exceptions include time/dates) • Values must increase by equal spacing and the same numeric interval.
(i.e. every box on the x-axis is the same size and increases in multiples of 10. On the y-axis, the boxes increase by 50 and are the same size.)
C. Bar Graph- similar to a line graph. It is used to show comparisons among data or to display data that do not continuously change. • X and Y-axis are set up the same as the line graph. • Data is plotted by drawing thick bars from the x-axis up to an imaginary point where the y-axis would intersect if the bar were extended.
To the right is an example of a bar graph showing the precipitation in Hartford, Conn. during the first half of April 1996)