Download
1 / 1
10 likes | 166 Views
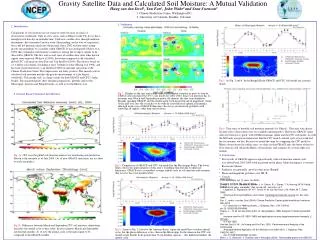
Gravity Satellite Data and Calculated Soil Moisture: A Mutual Validation (update) Huug van den Dool 1 , Yun Fan 1 , John Wahr 2 and Sean Swenson 2 1 Climate Prediction Center, Washington DC 2 University of Colorado, Boulder, Colorado. 3. Validation.

E N D
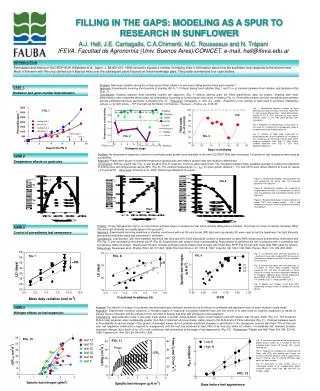
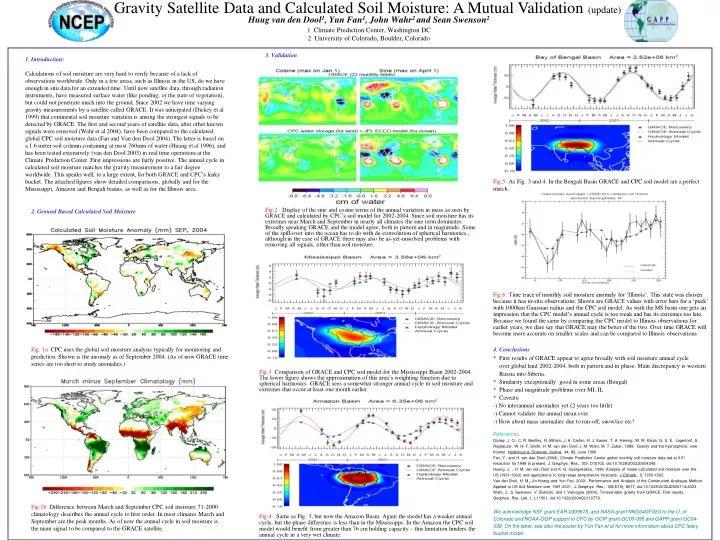
Gravity Satellite Data and Calculated Soil Moisture: A Mutual Validation (update) Huug van den Dool1, Yun Fan1, John Wahr2 and Sean Swenson21 Climate Prediction Center, Washington DC2 University of Colorado, Boulder, Colorado 3. Validation 1. Introduction:Calculations of soil moisture are very hard to verify because of a lack of observations worldwide. Only in a few areas, such as Illinois in the US, do we have enough in situ data for an extended time. Until now satellite data, through radiation instruments, have measured surface water (like ponding, or the state of vegetation), but could not penetrate much into the ground. Since 2002 we have time varying gravity measurements by a satellite called GRACE. It was anticipated (Dickey et al 1999) that continental soil moisture variation is among the strongest signals to be detected by GRACE. The first and second years of satellite data, after other known signals were removed (Wahr et al 2004), have been compared to the calculated global CPC soil moisture data (Fan and Van den Dool 2004). The latter is based on a 1.6 meter soil column containing at most 760mm of water (Huang et al 1996), and has been tested extensively (van den Dool 2003) in real time operations at the Climate Prediction Center. First impressions are fairly positive. The annual cycle in calculated soil moisture matches the gravity measurement to a fair degree worldwide. This speaks well, to a large extent, for both GRACE and CPC’s leaky bucket. The attached figures show detailed comparisons, globally and for the Mississippi, Amazon and Bengali basins, as well as for the Illinois area. Fig.5 As Fig. 3 and 4. In the Bengali Basin GRACE and CPC soil model are a perfect match. 2. Ground Based Calculated Soil Moisture Fig.2 Display of the sine and cosine terms of the annual variation in mass as seen by GRACE and calculated by CPC’s soil model for 2002-2004. Since soil moisture has its extremes near March and September in nearly all climates the sine term dominates. Broadly speaking GRACE and the model agree, both in pattern and in magnitude. Some of the spill-over into the ocean has to do with de-convolution of spherical harmonics., although in the case of GRACE there may also be as-yet-unsolved problems with removing all signals, other than soil moisture. Fig.6 Time trace of monthly soil moisture anomaly for ‘Illinois’. This state was chosen because it has in-situ observations. Shown are GRACE values with error bars for a ‘puck’ with 1000km Gaussian radius and the CPC soil model. As with the MS basin one gets an impression that the CPC model’s annual cycle is too weak and has its extremes too late. Because we found the same by comparing the CPC model to Illinois observations for earlier years, we dare say that GRACE may the better of the two. Over time GRACE will become more accurate on smaller scales and can be compared to Illinois observations. Fig. 1a CPC uses the global soil moisture analysis typically for monitoring and prediction. Shown is the anomaly as of September 2004. (As of now GRACE time series are too short to study anomalies.) 4. Conclusions * First results of GRACE appear to agree broadly with soil moisture annual cycle over global land 2002-2004, both in pattern and in phase. Main discrepancy is western Russia into Siberia. * Similarity exceptionally good in some areas (Bengal) * Phase and magnitude problems over MI, IL * Caveats: -) No interannual anomalies yet (2 years too little) -) Cannot validate the annual mean ever. -) How about mass anomalies due to run-off, snow/ice etc? Fig.3 Comparison of GRACE and CPC soil model for the Mississippi Basin 2002-2004. The lower figure shows the approximation of this area’s weighting function due to spherical harmonics. GRACE sees a somewhat stronger annual cycle in soil moisture and extremes that occur at least one month earlier. References.Dickey, J. O., C. R. Bentley, R. Bilham, J. A. Carton, R. J. Eanes, T. A. Herring, W. M. Kaula, G. S. E. Lagerloef, S. Rojstaczer, W. H. F. Smith, H. M. van den Dool; J. M. Wahr, M. T. Zuber, 1999: Gravity and the hydrosphere: new frontier. Hydrological Sciences Journal, 44, #3, June 1999Fan, Y., and H. van den Dool (2004), Climate Prediction Center global monthly soil moisture data set at 0.5° resolution for 1948 to present, J. Geophys. Res., 109, D10102, doi:10.1029/2003JD004345.Huang, J. , H. M. van den Dool and K. G. Georgakakos, 1996: Analysis of model-calculated soil moisture over the US (1931-1993) and applications to long range temperature forecasts. J Climate., 9, 1350-1362.Van den Dool, H. M., Jin Huang and Yun Fan, 2003: Performance and Analysis of the Constructed Analogue Method Applied to US Soil Moisture over 1981-2001. J. Geophys. Res., 108(D16), 8617, doi:10.1029/2002JD003114,2003 Wahr, J., S. Swenson, V. Zlotnicki, and I. Velicogna (2004), Timevariable gravity from GRACE: First results, Geophys. Res. Lett.,1, L11501, doi:10.1029/2004GL019779.We acknowledge NSF grant EAR-0309678, and NASA grant NNG04GF02G to the U. of Colorado and NOAA-OGP support to CPC by GCIP grant GC00-095 and GAPP grant GC04-039. On the latter, see also the poster by Yun Fan et al for more information about CPC leaky bucket model. Fig.1b Difference between March and September CPC soil moisture 71-2000 climatology describes the annual cycle to first order. In most climates March and September are the peak months. As of now the annual cycle in soil moisture is the main signal to be compared to the GRACE satellite. Fig.4 Same as Fig. 3, but now the Amazon Basin. Again the model has a weaker annual cycle, but the phase difference is less than in the Mississippi. In the Amazon the CPC soil model would benefit from greater than 76 cm holding capacity – this limitation hinders the annual cycle in a very wet climate.