Download
1 / 10
100 likes | 101 Views
Improve lead time and accuracy for severe weather warnings by using GOES sounder observations to predict severe weather outbreaks 1-6 hours in advance, filling the gap between radar nowcasts and NWP models.

E N D
Nearcasting Severe Convection Using the GOES Sounder Presented by Robert Aune
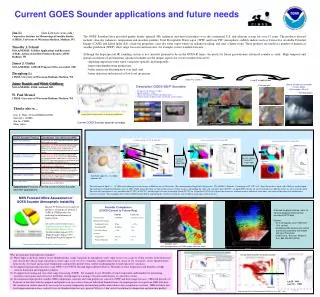
Requirement, Science, and Benefit Requirement/Objective • Mission Goal: Weather and water • Increase lead time and accuracy for weather and water warnings and forecasts • Improve predictability of the onset, duration, and impact of hazardous and severe weather and water events • Increase development, application, and transition of advanced science and technology to operations and services Science • Can observations from a geostationary IR sounder be used to predict severe weather outbreaks 1 to 6 hours in advance, filling the gap between radar nowcasts and NWP models? Benefits • Reduce loss of life, injury and damage to the economy • Better, quicker, and more valuable weather and water information to support improved decisions • Increased customer satisfaction with weather and water information and services
Challenges and Path Forward • Science challenges • Current GOES sounders cannot see low-level temperature inversions and dryness which leads to false alarms • Accurate mesoscale wind information is needed to initialize trajectories • Next steps • Assimilate additional products from the GOES sounder to determine which is the best indicator of de-stabilization • Perform Observing System Simulation Experiments (OSSEs) to determine the impact of using a hyperspectral sounder • Transition Path • Evaluation at NWS forecast office has commenced (AWIPS, webpage) • Evaluation at Storm Prediction Center Severe Weather Test Bed to commence May, 2010 (supported by GOES-R Risk Reduction) • Convert system to run at local forecast offices
Nearcasting Severe Convection Using the GOES Sounder • Research description • The GOES sounder can provide hourly snapshots of layer-averaged stability parameters. These observations can be assimilated at multiple levels using a simple approach to provide fast, short-term projections of atmospheric stability. • Recent science accomplishments (~FY08 to present) • In collaboration with CIMSS, a Lagrangian approach was selected that moves the GOES observations along forward trajectories. Observation error growth remains small to 4 hours and beyond. • GOES sounder retrieved parameters such as equivalent potential temperature (Theta-E) at 750hPa and 500hPa are projected forward 6 hours. Destabilization is indicated when Theta-E500 (5800m) minus Theta-E750 (2500m) becomes negative. • The nearcasting model has been tested in real time at CIMSS using the GOES-12 sounder. Products are displayed on the internet (http://cimss.ssec.wisc.edu/model/nrc). • Hourly nearcasts are currently being transmitted to NWS Central Region AWIPS for evaluation. • Product will be evaluated at the NWS Storm Prediction Center’s Spring Experiment in May 2010.
Filling the Guidance Gap and Atmospheric Stability Basics The GOES sounder can detect water vapor at 2-3 layers in a clear atmosphere. Gradients of water vapor can be tracked using multiple GOES sounder scans. Upper level drying over lower level moistening conditions lead to autoconvection. The Guidance Gap Very-short-range NWP precipitation forecasts often either: 1) miss significant moisture features 2) have difficulty with exact position and timing of events / phenomena Max Precipitation Axis When the layer is lifted the inversion bottom cools less than top and it becomes absolutely unstable 3hr Model Forecast Valid 1700 UTC 7/2/08 Max Precipitation Axis If moisture is present in the stable layer and the entire layer is lifted, it can become unstable. 2hr Model Forecast Valid 1700 UTC 7/2/08 Fill the Gap Between Nowcasting & NWP To detect the development of areas becoming convectively unstable, we need to monitor not only the increase of low level moisture, but areas where low-level moistening and upper-level drying overlap Verification 7/2/08 1700 UTC Radar 0 2 4 10 12 hours
Lagrangian Nearcasting Approach How it works NWP models use randomly spaced moisture observations interpolated on to a fixed grid, and use gridded wind data to advect the moisture information forward in time at fixed grid points. This process smooths horizontal gradients. GOES-12 900-700 hPa precipitable water analysis valid 21 UTC 13 April 2006 GOES-12 900-700 hPa precipitable water retrievals valid 00 UTC 14 April 2006 Dry Moist Dry Moist 3-hour Nearcast 0-hour Nearcast O O Starting location New location The Lagrangian approach interpolates wind data to each observation location (~10km spacing) which is then projected forward to a new location forced by dynamically changing wind forecasts. A relatively long time step (10 min) can be used. The new data locations are then transferred back to a regular grid.
Nearcasts of Severe Weather 6-hour NearCast for 2100 UTC Low level Theta-E Low-level Theta-E nearcasts shows warm moist air band moving into far NW Iowa by 2100 UTC. Oklahoma City tornado 6-hour NearCast for 2100 UTC Mid - Low level Theta-E Differences Vertical Theta-E Differences predict complete convective instability by 2100 UTC. De-stabilization predicted by nearcast Radar indicates rapid development of convection over NW Iowa between 2000 and 2100 UTC, 9 July 2009. Correct shape is indicated. 4-hour nearcast of precipitable water lapse rate (mm differences) near Oklahoma City valid 22UTC Feb 10, 2009. De-stabilization potential is indicated.
Evaluation by NWS Forecast Office, Sullivan, Wisconsin NWS Milwaukee is evaluating the CIMSS precipitable water nearcasting product. The example below shows a good relationship between amount of convective clouds (or lack of them) and strong vertical gradients of PW. CIMSS nearcast products are currently being inserted into the operational AWIPS data stream for NWS evaluation. CIMSS precipitable water lapse rate product valid 15UTC April 13, 2009. 1-hour nearcast of vertical precipitable water differences (mm) valid 19 UTC, July 2, 2009. Same CIMSS nearcast product displayed on an AWIPS workstation. Visible image for 19 UTC, July 2, 2009. Red indicates where convection is likely. Black indicates areas where convection is not likely.
Improved Nearcasting of Severe Weather using a Hyperspectral Environmental Sounder (HES) Weak gradients of low-level Theta-E are indicated by ABI which has only two water vapor channels. Strong low-level Theta-E gradients are indicated by HES which has the ability to detect low-level moisture. The nearcasting model was tested using simulated observations from the Advanced Baseline Imager (ABI), and a proposed geostationary Hyper-spectral Environmental Sounder (HES). Temperature and moisture profiles were retrieved from the radiance datasets and assimilated by the CIMSS Nearcasting Model and compared. Detailed Theta-E gradients were resolved by HES. Simulated ABI Simulated HES 5-hour NearCast for 2000 UTC Low level Theta-E 5-hour NearCast for 2000 UTC Low level Theta-E Simulated composite reflectivity from nature run indication the formation of convection. Simulated ABI Simulated HES 5-hour NearCast for 2000 UTC Low to Mid level Theta-E Differences 5-hour NearCast for 2000 UTC Low to Mid level Theta-E Differences Rapid Development of Convection over Texas and Nebraska between 2000 and 2100 UTC 12 June 2002
Challenges and Path Forward • Science challenges • Current GOES sounders cannot see low-level temperature inversions and dryness which leads to false alarms • Accurate mesoscale wind information is needed to initialize trajectories • Next steps • Assimilate additional products from the GOES sounder to determine which is the best indicator of de-stabilization • Perform Observing System Simulation Experiments (OSSEs) to determine the impact of using a hyperspectral sounder • Transition Path • Evaluation at NWS forecast office has commenced (AWIPS, webpage) • Evaluation at Storm Prediction Center Severe Weather Test Bed to commence May, 2010 (supported by GOES-R Risk Reduction) • Convert system to run at local forecast offices