Download

1 / 26
260 likes | 431 Views
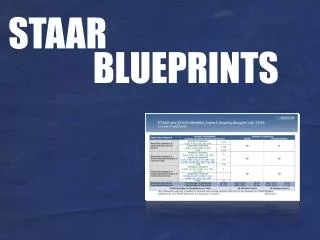
STAAR Strategies. QAR Question Answer Relation. RIGHT THERE. THINK AND SEARCH. ON MY OWN. RIGHT THERE easy to find, in the same sentence (who, what, when, where) THINK AND SEARCH in the reading but not in the same sentence (how to do, how many) AUTHOR AND ME

E N D
QAR Question Answer Relation RIGHT THERE THINK AND SEARCH ON MY OWN RIGHT THERE easy to find, in the same sentence (who, what, when, where) THINK AND SEARCH in the reading but not in the same sentence (how to do, how many) AUTHOR AND ME not in the reading; I must think how to use clues from the text to figure out the answer. ON MY OWN not there; I don’t need the reading to answer the question. I already know the answer from my background knowledge. BOOK AUTHOR AND ME BRAIN 1. Read the question first. 2. Decide which of the 4 QAR methods to use. 3. Find the answer in the text OR use my thinking skills OR use my memory.
Quotation Attack Skills 1. UseQAR. Read the question. What is the question asking? 2. Determine the historical issue/event in the quote. 3.LOOK FORLocation reference Time reference Gender Race Religion Ethnicity Point of View 4. Read the answers and eliminate the wrong choices. 5. Choose theMOST CORRECTanswer. “Fasting and similar discipline is, therefore, one of the means to the end of self-restraint, but it is not all, and if physical fasting is not accompanied by mental fasting, it is bound to end in hypocrisy and disaster.” Mohandas K. Gandhi, The Story of My Experiments with Truth
1. Use QAR. Read the question to identify which speaker(s) is needed to answer the question. 2. Read only the speaker(s) needed to answer the question. 3. Read ALL the possible answers CAREFULLY. 4. Eliminate the answers that do not apply to the speaker(s). 5. Choose the answer that is MOST CORRECT. (Look for key words / synonyms) Drawing Conclusions from Multiple Speakers Speaker W:In my country, families are small and health care is readily available. Speaker X: In my country, the majority of the population lives in urban areas. Speaker Y: In my country, families are large and health services are very limited. Speaker Z: In my country we have many manufacturing and service industries. Speaker Z is describing A.The social structure of a developing nation. B.The economic base of a developed nation. C.The social structure of a developed nation. D.The political structure of a developing nation.
Drawing Conclusions & Making Inferences 1. Read the selection carefully to understand all of the facts. 2. Decide the meaning of the selection. 3. Try to find facts in the selection that support your choice for the answer. * Read to see what is suggested by the facts, but may not actually be stated. * Read between the lines to analyze the selection. “Now it seems as though our mother planet is telling us, ‘My children, my dear children, behave in a more harmonious way. My children, please take care of me.’ ” Dalai Lama The main focus of the Dalai Lama’s statement is A. encourage international trade. B. prevent environmental destruction. C. improve race relations. D. end poverty and disease.
Multiple Choice Questions 1. Use QAR. Read the question. Do you already know the answer? 2. Ask yourself - Do I need the “visual” to answer the question? 2. Read ALL the choices beforeselecting an answer. 3. Eliminate the answers that do not fit. 4. Select the MOST CORRECT answer. WATCH FOR: context clues subject / verb agreement negative words - not, except time sequence - earliest to latest / latest to earliest does your choice answer the question? What large country today occupies the major portion of the Arabian Peninsula? a. Kuwait c. Sudan b. Iran d. Saudi Arabia
How to Handle Questions that Have Info You Have Never Seen 1. DO NOT PANIC! Do not focus on the “info” you do not recognize. 2. Focus only on the “info” you know. 3. Use QAR. What is the question asking? 4. Eliminate the answers that do not apply. 5. Choose the MOST CORRECT answer. Which is the most likely explanation for the infant mortality rate and life expectancy rate in Papua New Guinea? A. High per capita GDP B. High literacy rate C. Harsh climate D. Limited availability of health care DEMOGRAPHIC STATISTICS Country Birth Rate Death Rate Infant Mortality Life Expectancy New Zealand 22 8 25 67 Panama 22 4 18 73 Papua New Guinea 34 10 63 56 29 7 60 66 Peru
Using theOPTICsystem The five letters in the word OPTIC (pertaining to the eye) provide a system for remembering the five steps for analyzing a visual: Ois for overview •Conduct a brief overview of the visual. P is for parts • Focus on the parts of the visual. • Read all labels. • Notice any details that seem important. Tis for title • Read the title of the visual for a clear understanding of the subject. I is for interrelationships • Use the title to help identify the main idea or the big umbrella that connects the parts of the visual. C is for conclusion • Draw a conclusion about the visual as a whole. What does it mean? -- Why was is included? •Summarize the visual in one or two sentences.
Political Cartoon Questions 1. Title 2. Captions & Labels 3. Symbols 4. Caricatures (exaggerated facial features) 5. Stereotyping 6. MAIN IDEA
Reading a Graph Bar Graph Line Graph Circle Graph Graphs (Charts) are combinations of symbols, words, and numbers that show information in a clear and simple way. 1. Read the title. 2. Identify the main idea. 3. Identify the symbols. 4.Look for the legend. (On line graphs & bar graphs: Read the x and y descriptors.)
Hints for a line graph: * They commonly measure quantities or amounts of data. *They are used to make more specific comparisons. * Carefully read x and y axes - and what they represent. Hints for a pie graph: * the circle represents the whole. * the slices represent parts of the whole (subgroups). Hints for a bar graph: * They commonly measure quantities or amounts of data. * They make it easy to compare information. * Carefully read x and y axes - and what they represent.
Comparing/Contrasting Multiple Charts 1. Identify what the question is asking. (HINT: You may not need to look at both charts.) 2. Read the titles on the charts. 3. Read the data in the charts & look for relationships. 4. Eliminate the wrong answers. 5. Choose the MOST CORRECT answer. Which statement best summarizes the information in the charts? A. Life expectancy is longer in Eastern Europe. B. Life expectancy is longer for women in Eastern Europe. C. Life expectancy is shorter, in general, in Eastern Europe. D. Life expectancy is shorter for women in Eastern Europe.
Cause and Effect 1. Use QAR. Read the question carefully - Is it asking for cause or effect? 2. Predict an answer. 3. Read all the choices carefully. 4. Pay close attention to words such as: CAUSE: EFFECT: becauseconsequently as basis forleading to due toresulted in sincemajor result thereforeaffect / effect before in response to if then after 5. Be sure to notice negative words, such as: exceptfor, isnot, excluding. 6. Choose the MOST CORRECT answer.
Cause & Effect Example The most important result of the Great Potato Famine was A. North America received large numbers of immigrants. B. The potato blight spread to Germany. C. Landlords willingly gave their surpluses of corn and dairy products to the starving people of Ireland. D. Ireland’s population was reduced by half as a result of the potato famine. The Great Potato Famine In 1845, a blight (disease) devastated Ireland’s potato crop, and it returned the next few years. The potato blight was not peculiar to Ireland; in fact, it began in North America. In the midst of the potato famine, corn, cattle, and dairy products continues to be produced in Ireland. But rather than give these foodstuffs to the starving, landlords sold them abroad for profits….The nation lost a third of its population during the 1845-1855 famine - more than a million died from starvation or disease. At least another 1 3/4 million fled their native land - 8 in 10 bound for the United States, most of the rest for Canada.
Identifying Trends Use historical people, events, and important dates as clues to help you identify the time period. Example: Athens Greece (400 BC) (2000 AD) These questions involve historical changes over time. These are “big picture” concepts that bridge more than one time period. CITY STATES NATION STATES 1. Key words are words that imply change, such as: “has led to” “account for”“best supported by”. 2. Look for descriptive words that describe the feelings of that time. Look for emotional words. 3. 4. The BEST answer will logically answer the question. HINT: Does your answer make sense?
Questions Using a Flow Chart Oil supply from Kuwait drastically reduced. Iraq attacks Kuwait and sets oil well fires. Red Adair and like companies are hired. ? A flow chart is a multiple cause and effect question. The first statement is a cause of the second statement; the second statement becomes the cause of the third statement and so forth. The statements are all related. A question presented in a flow chart wants you to determine what the next most logical step would be. In this case, the answer could be “Oil prices increase worldwide.”
Interpreting a Population Pyramid • Remember that a population pyramid is basically a bar graph turned on its side. Each line is showing you what percentage of the population is a certain age. • Examine the title and the type of data presented.(ex. Age breakup, numbers listed below, male-female notation.) • True pyramids are developing countries. The majority of the population is younger and not many people live to an old age. Developed countries are more rectangular; the population is spread more equally through the age groups.
Examining Maps www.lib.utexas.edu/maps Overview = Subject, type of map (phy, political, thematic) Parts = Legend, scale, labels, shading, symbols, inserts Title = Often in legend, frequently includes location, date, and map theme Interrelationships = Patterns related to location and map content (such as population density, diffusion path, or vegetation distribution) ; pay attention to key regarding shading (dark is not always more, water is not always blue) Conclusions = Generalizations, trends, or patterns evident from the map information Examine the Map’s TODALSIGS Title, Orientation, Date, Author, Legend, Scale, Index, Grid, Symbols
Recognizing Different Maps Worldpress.org Political Map Pictorial Map mappery.com Physical Map Cartogram -Actual size/shape changed to reflect data Fordham Institute USGS Topographic map of Stowe, Vermont maps-for-free.com Relief map of Spain maps.complutense.org NY Subway Map
“Reading” GIS Imagery Houston, Texas Square, checkerboard or quilt pattern usually indicate agriculture (different greens equal different types of crops) Rivers, streams, and bayous appear as wavy lines (irregular, wavy=nature). If image has color, water is usually but not always colored blue or dark grey. Lighter shades typically indicate sparse vegetation or more shallow water (may also show soil erosion in water) Darker shades typically indicate thicker vegetation or deeper water Brown, light tan is usually an indication of soil exposure (as in clearing for development, planting or natural settings such as deserts and beaches) Light grey = populations, development, urbanization (straight lines = man made)
“Reading” GIS Imagery Houston, Texas Square, checkerboard or quilt pattern usually indicate agriculture (different greens equal different types of crops) Rivers, streams, and bayous appear as wavy lines (irregular, wavy=nature). If image has color, water is usually, but not always, colored blue or dark grey. Lighter shades typically indicate sparse vegetation or more shallow water (may also show soil erosion in water) Darker shades typically indicate thicker vegetation or deeper water Brown, light tan is usually an indication of soil exposure (as in clearing for development, planting or natural settings such as deserts and beaches) Light grey = populations, development, urbanization (straight lines = infrastructure, man made)
Drag labels to show the corresponding feature on the GIS image Bush Intercontinental Airport Galveston Bay Sam Houston Toll way/Beltway Bear Creek Park and Flood Plain
Drag labels to show the corresponding feature on the GIS image http://www.wpmap.org/physical-map-of-africa/ Mt. Kilimanjaro volcano Lake Victoria water Great Rift Valley elevation change Nile River water Sahara desert Bab al Mandab chokepoint Congo Basin vegetation
2ols.com Warning: The colors used in GIS changes. Shading (dark to light) is more consistent. GIS images are often shaded to show details. In the image to the right, green vegetation is colored red. The Greater Houston Metropolitan area is seen, with urban areas blue- grey and suburban areas white-pink. Houston city is at center. Bush International airport is at top center visible with white runways. North Freeway is the white motorway running from the city north. At top right is Lake Houston with its dam wall; the navigable Buffalo Bayou runs from the city to the north tip of Galveston Bay (at right). Summer Winter
Can you match the label to the correct image? Hawaii Nile River California Mediterranean Sea AndesMountains Great Salt Lake Rocky Mountains Volcano Sahara Spain Italy