1 / 10

E N D
Econometrics Muhammad Ali, A/P Statistics GPGC Mardan November 26, 2020 Muhammad Ali, A/P Statistics (GPGC Mardan) Econometrics November 26, 2020 1/10
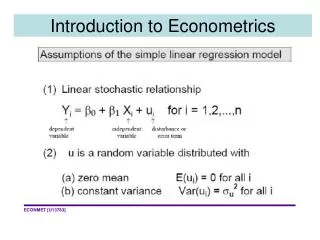
Introduction 1.1 What is Econometrics Econometrics means "economic measurement", scope of econometrics can be seen in the following quotations Application of mathematical statistics to economic data to obtain useful results. Actual economic phenomena based on the concurrent develop- ment of theory and observation, related by appropriate methods of inference. Econometrics may be defined as the social science in which the tools of economic theory, mathematics, and statistical inference are applied to the analysis of economic phenomena. Muhammad Ali, A/P Statistics (GPGC Mardan) Econometrics November 26, 2020 2/10
Introduction 1.2 Methodoloyg of Econometrics Broadly speaking, traditional econometric methodology can be defined in the following lines: 1 Statement of theory or hypothesis 2 Specification of the mathematical model of the theory 3 Specification of the statistical, or econometric, model 4 Obtaining the data 5 Estimation of the parameters the econometric model 6 Hypothesis testing 7 Forecasting or prediction 8 Using the model for control or policy purposes To define the above steps, let us consider the well-known Keynesian theory of consumption. Muhammad Ali, A/P Statistics (GPGC Mardan) Econometrics November 26, 2020 3/10
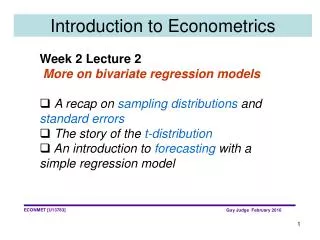
Introduction 1. Statement of Theory of Hypothesis According to Keynesian theory the average consumption of a person in- creases with income, but not as much as the income increases. In short, Keynes postulated that the marginal propensity to consume (MPC), the rate of change of consumption for a unit (say, a dollar) change in in- come, is greater than zero but less than 1. Muhammad Ali, A/P Statistics (GPGC Mardan) Econometrics November 26, 2020 4/10
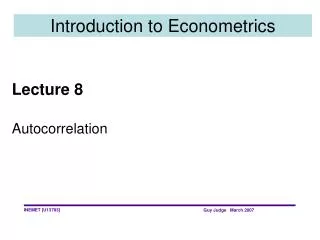
Introduction 2. Specificatioin of the Mathematical Model for Consumption Mathematical form of the Keynesian consumption function might having the following form: Y = β1+ β2X 0 < β2< 1 (1) where Y = consumption expendi- ture and X = income, and where β1 and β2, known as the parameters of the model, are, respectively, the in- tercept and slope coefficients. Figure: Keynesian consumption function Muhammad Ali, A/P Statistics (GPGC Mardan) Econometrics November 26, 2020 5/10
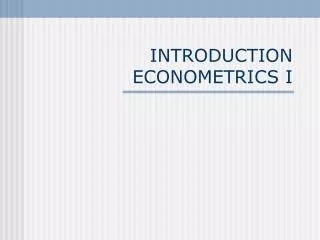
Introduction 3. Specificatioin of the Econometric Model for Consumption There is no exact relationship between income and expenditure, and therefore Equation 1 is not an appropriate choice. Since the relationship between income and consumption is not exact, therefore we need an econometric model for Keynesian theory, and is given below: Y = β1+ β2X + u (2) where u, known as the disturbance, or error. Equation (2) is an exam- ple of an econometric model. More technically, it is an example of a lin- ear regression model. Figure Muhammad Ali, A/P Statistics (GPGC Mardan) Econometrics November 26, 2020 6/10
Introduction 4. Data To estimate the econometric model given in (2), that is, to obtain the numerical values of β1and β2, we need data. Please read table 1.1 given in the book, this table having data of the U.S. economy for the period 1981-1996. The Y variable in this table is the aggregate (for the economy as whole) personal consumption expenditure (PCE) and the X variable is gross domestic product (GDP). 5. Estimation of the Econometirc Model After obtaining the data our next task is to estimate the numerical values of β1and β2. Using data of table 1.1 these estimates are -184.08 and 0.7064. Therefore, the estimated consumption function is: ˆY = −184.08 + 0.7064X (3) Muhammad Ali, A/P Statistics (GPGC Mardan) Econometrics November 26, 2020 7/10
Introduction 6. Testing of Hypothesis We need to verify that our estimated model is according with the the- ory or not? In current case we have to check that the estimated model given in equation 3 is according to the Keynesian theory or not? Ac- cording to the theory the value of the MPC must be less than 1, and in the estimated model it is 0.70 (less than dollar 1).Such confirmation or refutation of economic theories on the basis of sample evidence is based on a branch of statistical theory known as statistical inference (hypothesis testing). Throughout this book we shall see how this infer- ence process is actually conducted. Muhammad Ali, A/P Statistics (GPGC Mardan) Econometrics November 26, 2020 8/10
Introduction 7. Forecasting or Prediction If the fitted model accepts the theory or hypothesis, we may use it to predict the future value(s) of the dependent, or forecast, variable Y on the basis of known or expected future value(s) of the explanatory, or predictor, variable X. To illustrate, suppose we want to predict the mean consumption expenditure for 1997. The GDP value for 1997 was 7269.8 billion dollars. Putting this value in equation 3, i.e. ˆ Y1997= −184.08 + 0.7064(7269.8) = 4951.3167 Thus, given the value of the GDP, the mean, or average, forecast con- sumption expenditure is about 4951 billion dollars, whereas the actual value for the said period is 4913.5 billion dollars, and thus the estimated model over-predicted the actual consumption expenditure by 37.82 bil- lion dollars. (4) Muhammad Ali, A/P Statistics (GPGC Mardan) Econometrics November 26, 2020 9/10
Introduction 8. Use of the Model for Control or Policy Purposes An estimated model like one given in equation 3, may be used for con- trol, or policy, purposes. By appropriate fiscal and monetary policy mix, the government can manipulate the control variable X to produce the desired level of the target variable Y. See figure 1.4 in book. Types of Econometrics Econometrics may be divided into two categories Theoretical Theoretical econometrics concerns with the development of the methods for measuring economic relationship. Applied In applied econometrics we use the tools of theoretical economet- rics to study some special field(s) of economics and business. Muhammad Ali, A/P Statistics (GPGC Mardan) Econometrics November 26, 2020 10/10