Download
1 / 31
410 likes | 683 Views
ES5611 Introduction to Econometrics. Introductory remarks What is Econometrics? What is this course like?. Slides by Ken Clark, adapted from P. Anderson, 2004. Introductory Remarks. Lecturer: Ken Clark, N.5.6, Dover Street email: ken.clark@man.ac.uk

E N D
ES5611Introduction to Econometrics Introductory remarks What is Econometrics? What is this course like? Slides by Ken Clark, adapted from P. Anderson, 2004.
Introductory Remarks • Lecturer: Ken Clark, N.5.6, Dover Street • email: ken.clark@man.ac.uk • http://www.ses.man.ac.uk/clark/es561/ • Office Hours: Wednesday 10-12
What is Econometrics? • Some definitions • Why study econometrics? • The Econometric Process • Example: wages and productivity • Types of data • Causality • Examples
Definition (outputs) Wooldridge: “statistical methods for estimating economic relationships, testing economic theories, and evaluating and implementing government and business policy” (p.1). Ramanathan: “(1) estimating economic relationships, (2) confronting economic theory with facts and testing hypotheses involving economic behaviour, and (3) forecasting the behaviour of economic variables”
Definition (outputs) Estimation/Measurement Inference/Hypothesis testing Forecasting/Prediction Evaluation
Definition (inputs) • Ingredients of an econometric exercise: • Economic Theory • Mathematics • Statistical Theory • Data • Computing Power • Interpretation/Economic Knowledge/Common Sense.
Why study Econometrics? • It is rare in economics to have experimental data • Econometrics uses nonexperimental, or observational, data to draw conclusions about the real world • This enables us to apply economic theory to real world data
Why study Econometrics? Econometrics can test and refine economic theory Theory may be ambiguous about impact of a policy change – econometrics can evaluate the policy program Econometric analysis is useful to decision makers.
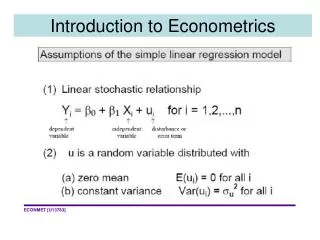
Example: wages and productivity • wage=f(educ, exper, training) • deterministic economic model • wage=β0+ β1educ + β2 exper + β3training + u • econometric (statistical model) • u – random error term • β’s parameters.
Example • use computer to estimate the parameters • what is the ceteris paribus effect of educ on the wage? what are the returns to education • and to test hypotheses (inference) • is β3=0? (a more subtle question than it seems) • could also forecast wages for workers with given characteristics (e.g. to predict how much an accident victim would have earned in future).
Types of Data – Cross Sectional • Cross-sectional data are usually a random sample from some population • Each observation is a new individual, firm, household, etc. with information at a point in time • If the data are not a random sample, we have a sample-selection problem
Types of Data – Time Series • Time series data has a separate observation for each time period – e.g. stock prices • Since not a random sample, different problems to consider • Trends and seasonality will be important
Types of Data – Panel • Can follow the same random individual observations over time – known as panel data or longitudinal data • ES5622 covers this.
The Question of Causality • Simply establishing a relationship between variables is rarely sufficient in economics • Want to the effect to be considered causal • If we’ve truly controlled for enough other variables, then the estimated ceteris paribus effect can often be considered to be causal • Can be difficult to establish causality: problem of endogeneity
Example 1: Returns to Education • A model of human capital investment implies getting more education should lead to higher earnings • A simple econometric model: Is β1 truly the returns to education? Does more education cause higher earnings?
Example 1: (continued) • Problem: Suppose more ‘able’ people have (a) higher earnings and (b) more education. • Observed relationship between education and earnings could actually reflect impact of ability – model gives the wrong answer • Technically E(u|educ) E(u). Education and error are correlated. Endogeneity.
Example 1: (continued) • Two situations where we’re OK: • No relationship between education and ability • We observe ability and include it in the model (control for ability): Frequently one or both does not hold.
Example 2: Policing and Crime • Do more police reduce crime? • Does β1 reflect causal influence of police on crime? • But cities with high crime rates may employ more police
Causality: Roundup • “The key question… is: Have enough other factors been held fixed to make a case for causality?” • “When carefully applied, econometric methods can simulate a ceteris paribus experiment” • (Wooldridge, p. 14).
What is this course like? • 10 two hour lectures (Mondays 2-4pm) • 9/10 Examples Classes (START 11/10/04) • allocation and details to follow • exercise sheets to follow • students should attempt exercises prior to examples class • Assessment: Two hour examination in January 2005. • Note: course changed substantially in 03/04.
What is this course like? • Computing: we will use Stata and Microfit. • Microfit available from all networked PCs • Stata available in O.G.10, Dover St. and Williamson 3.59. • Find under: Programs/Faculty/FSSL/ • Stata is called Intercooled Stata8 • Microfit is called Microfit 4 on the Econometric Software sub menu
What is this course like? Stata Tutorial: There will be a one hour Introduction to Stata tutorial in Room O.G.10 THIS WEEK (w/b 27/09/04). You should sign up for this tutorial on the sheets on the wall outside Room N.5.3, Dover St.) Sign up for one only and note there is a maximum of 20 places in each session.
What is this course like? Reading: All students should purchase Wooldridge, Jeff, Introductory Econometrics: A Modern Approach, Second Edition, South-Western Thomson, 2003. Available in Blackwells, Precinct Centre.
Course Objectives An introductory econometrics course Assumes no previous knowledge of econometrics. On completion of the course students should be able to understand the results of econometric procedures which they read about in applied economics research and to use basic econometric techniques in their own work.
Course Objectives Students who have studied introductory econometrics before will benefit from taking either ES5521 Time Series Econometrics or ES5501 Advanced Econometric Theory rather than ES5611. Students should consult the lecturers of these courses or their course director if unsure which to choose.
Student Background Assume some familiarity with: random variables, population vs. sample, expectation, correlation, independence, variance, sampling, estimation, hypothesis testing. Important material from pre-session maths course: linear functions, differential calculus,
Warning • There will be some revision of key concepts next week but it is YOUR responsibility to ensure your background is sufficient. • Sample supplementary reference on introductory statistics: • Wonnacott and Wonnacott, Introductory Statistics for Business and Economics, 4th ed., 1990, Wiley.
Advice Econometrics is a mixture of many ingredients: maths, stats, economics, computing. Break the problem down. Keep your eye on the…
Topics • See course outline • based around estimation and testing of multiple regression model • follows Wooldridge closely. • Next week: review of key concepts • Reading: Wooldridge, Appendices A, B, C1, C2, C5, C6.