Download
1 / 16
160 likes | 409 Views
Presentation of Ungrouped Numerical Data. Presentation of Ungrouped Numerical Data. Two Forms: Raw Data and Ordered Array. A Large Sample Example (presented as Raw Data ). The following sample (n = 120) of data contains the number of years that a company was in business.

E N D
Presentation of Ungrouped Numerical Data
Presentation of Ungrouped Numerical Data Two Forms: Raw Data and Ordered Array
A Large Sample Example (presented as Raw Data) The following sample (n = 120) of data contains the number of years that a company was in business.
A Large Sample Example (presented as an Ordered Array) The following sample (n = 120) of data contains the number of years that a company was in business.
A Small Sample Example (presented as Raw Data) The following sample (n = 7) of data contains the number of years that a company was in business.
A Small Sample Example (presented as an Ordered Array) The following sample (n = 7) of data contains the number of years that a company was in business.
Two Samples of Stock Prices (Presented as Raw Data)
Two Samples of Stock Prices (Presented as Ordered Arrays)
Graphical Presentation of Ungrouped Numerical Data
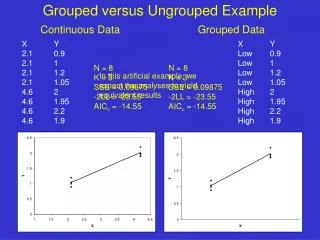
Comparing Data Sets with respect to: Location Variability (Dispersion) Shape
Find the following measures of LOCATION. Central Tendency Measures: _ 1) mean (X) 2) median (M) 3) mode Noncentral Tendency Measures: (Quantiles or Fractiles) 1) First Quartile (Q1) 2) Third Quartile (Q3) 3) Sixth Decile (D6) 4) Eighty-third percentile (P83)
Find the following measures of VARIABILITY (DISPERSION). 1) Range 2) Interquartile Range (IQR) 3) Variation (SS) 4) Variance (S2) 5) Standard Deviation (S) 6) Coefficient of Variation (CV)
Find the SHAPE of a data set. 1) Symmetric 2) Skewed a) left skewed (negatively skewed) b) right skewed (positively skewed) First, LOCATION is examined.