Download
1 / 69
700 likes | 902 Views
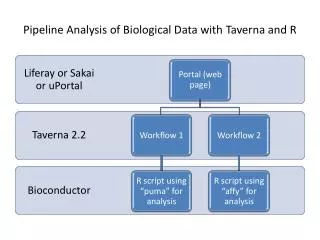
NUMERICAL ANALYSIS OF BIOLOGICAL AND ENVIRONMENTAL DATA. Lecture 2. Exploratory Data Analysis. EXPLORATORY DATA ANALYSIS. Types of variables Simple diagrams Summary statistics (i) Location (ii) Dispersion (iii) Skewness and kurtosis Transformations Density estimation

E N D
NUMERICAL ANALYSIS OF BIOLOGICAL AND ENVIRONMENTAL DATA Lecture 2. Exploratory Data Analysis
EXPLORATORY DATA ANALYSIS Types of variables Simple diagrams Summary statistics (i) Location (ii) Dispersion (iii) Skewness and kurtosis Transformations Density estimation Graphical display (i) Univariate data (ii) Bivariate and multivariate data Outliers Leverage and influence Software
TYPES OF VARIABLES • discrete e.g. counts • continuous e.g. pH, elevation • Both are random variables or variates, with random variation. TABULAR PRESENTATION Raw data Frequency tables
n/10 bins SIMPLE DIAGRAMS DISCRETE VARIABLES DISCRETE OR CONTINUOUS VARIABLES Dot diagram Line diagram or profile Histogram Frequency graph or cumulative frequency graph CONTINUOUS VARIABLES
HISTOGRAM BIN WIDTHWand (1997) Amer. Statistician 51, 59-64 DEFAULT S-PLUS Histograms of the British Incomes Data Based on (a) the Bin Width ĥ2 (b) the Bin Width ĥ0, and (c) the S-PLUS Default Bin Width.
Histogram Bin Width In R, a good option for histogram bin width is given by the Freedman-Diaconis rule which is: where n is the number of observations, max-min is the range of the data, and Q3-Q1 is the inter-quartile range. The brackets represent the ceiling, which means that you round up to the next integer, thereby avoiding 4.2 bins!
Exploratory Data Analysis • Summary Statistics • Measures of location ‘typical value’ • (1) Arithmetic mean • (2) Weighted mean • (3) Mode ‘most frequent’ value • (4) Median ‘middle values’ Robust statistic • (5) Trimmed mean 1 or 2 extreme observations at both tails deleted • (6) Geometric mean R
Q1 Q2 Q3 ignore negative signs Mean absolute difference 10/n = 2.5 (B) Measures of dispersion • Range A = 0.37 B = 0.07 • (2) Interquartile range ‘percentiles’ (3) Mean absolute deviation
(B) Measures of dispersion (cont.) (4) Variance and standard deviation Variance = mean of squares of deviation from mean Root mean square value SD (5) Coefficient of variation Relative standard deviation Percentage relative SD (independent of units) mean (6) Standard error of mean R
(C) Measures of skewness and kurtosis Skewness - measure of how one tail of curve is drawn out Kurtosis - measure of peakedness of curve g1 skewness measure g2 kurtosis measure “moment statistics” Central moment = r = 1 deviation from mean = 0 r = 2 variance g1skewnessr = 3 [third central moment divided by sd3] g2kurtosisr = 4
Skewness and kurtosis negative g1 skewness to left positive g1 skewness to right negative g2 platykurtosis flatter, larger tails positive g2 leptokurtosis taller, few tails
sd frequency mean 66% 95% x DATA TRANSFORMATIONS • Comparability • Better fit to model Better fit Normal distribution Comparability Data centring - deviations from mean Data standardisation - zero mean, unit variance 1 sd = 66% of values 2 sd = 95% of values Often find skewed to right positive g1 Log-normal distribution
LOG-NORMAL DISTRIBUTION PROPERTIES • How to decide whether to log transform? • (1) Look at histograms. Right skewed (positive g1) log transform • If sd > mean or maximum value of variable > 20x than smallest value • Log xi or Log (xi + 1) • (3) Improves normality • (4) Gives less weight to ‘dominants’ VARIANCE STABILISING • (5) Reflects linear response of many species to log of chemical variables, i.e. log response over certain ranges. • (6) In regression need normally distributed random errors. Log transformation.
x x x x x x x x x NORMAL AND LOG-NORMAL DISTRIBUTIONS
METHODS FOR DESCRIBING LOG-NORMAL DISTRIBUTIONS Graphical methods Frequency plots, histograms, box plots Parameters Logarithm of x Mean Median Standard deviation Variance Skewness and kurtosis of x Problems What logarithm base to use? Parameters are not on the scale of the original data Appear to be very common in the real world Limpert, E, et al. 2001 BioScience 51 (5), 342-352
(2) Environmental variable skewed to right log-normal distribution DATA TRANSFORMATIONS (1) If SD > mean or maximum value of x > 20 times the smallest, use log (x + c) transformation where c is constant, usually 1.
Other transformations: (1) square root (2) cubic root (3) fourth root (4) log2log2 (x + 1) (5) logplogp (x + 1) (6) Box-Cox transformation - most appropriate value for exponent λ where λ 0= log x where λ = 0 If = 1 no transformation = 0.5 square root = -1 reciprocal transformation = 0 log transformation If x = 0.0, add 0.5 or 1.0 as constant Can also solve for best estimate of constant to add Can calculate confidence limits for λ. If these include 1, no need for a transformation! TRANSFOR
DENSITY ESTIMATION A useful alternative to histograms is non-parametric density estimation which results in a smoothing of the histogram. The kernel-density estimate at the value of x of a variable X is given by where xj are the n observations of X, K is a kernel function (such as the normal density), and b is a bandwidth parameter influencing the amount of smoothing. Small bandwidths produce rough density estimates, whereas large bandwidths produce smoother estimates. Note that the histogram has been scaled to the density estimates, not the raw frequencies.
Multiple approaches • Histogram with density scaling (areas of histogram bars sum to 1) • Density estimation (default) (thick line) • Density estimation (half the default bin-width) (thin line) • One-dimensional scatter-plot ("rugplot") to show distribution of observations at the bottom Fox, 2002
QUANTILE-QUANTILE PLOTS Quantile-quantile (Q-Q) plots are useful tools for determining if data are normally distributed. They show the relationship between the distribution of a variable and a reference or theoretical distribution. Q-Q plot shows the relationship between the ordered data and the corresponding quantiles of the reference (in our case, normal) distribution. If the data are normally distributed, they should plot on a straight line through the 1st and 3rd quartiles. If there is a break in slope of the plotted points, the data deviate from the reference distribution. Note that quantiles are divisions of a frequency or probability distribution into equal, ordered subgroups (e.g. quartiles (4 parts) or percentiles (100 parts)).
EXPLORATORY DATA ANALYSIS GRAPHICAL DISPLAY J.W. Tukey Univariate data (1) Stem-and-leaf displays 55 62 73 78 79 78 81
CI around median 95% Median 1.58 (Q3) / (n)½ quartile (2) Box-and-whisker plots - box plots (3) Hanging histograms
Variations of box plots McGill et al. Amer. Stat. 32, 12-16
Useful to label extreme points Fox, 2002
Box plots for samples of more than ten wing lengths of adult male winged blackbirds taken in winter at 12 localities in the southern United States, and in order of generally increasing latitude. From James et al. (1984a). Box plots give the median, the range, and upper and lower quartiles of the data.
x2 x1 Bivariate and multivariate data Simple scatter plot
SCATTERPLOT MATRIX. The data are measurements of ozone, solar radiation, temperature, and wind speed on 111 days. Thus the measurements are 111 points in a four-dimensional space. The graphical method in this figure is a scatterplot matrix: all pairwise scatterplots of the variables are aligned into a matrix with shared scales.
Triangular arrangement of all pairwise scatter plots for four variables. Variables describe length and width of sepals and petals for 150 iris plants, comprising 3 species of 50 plants. Three-dimensional perspective view for the first three variables of the iris data. Plants of the three species are coded A,B and C.
Can explore scatter-plot by adding box-plots for each variable, add simple linear regression line, add smoother (LOWESS – see Lecture 5), and label particular points. Fox, 2002
Categorical variables can be encoded in a plot by using different symbols or colours for each category (e.g. type of occupation) and smoothers fitted for each category. Fox, 2002 bc = blue collar, prof = professional, wc = white collar
Jittering scatter-plots Discrete quantitative variables usually result in uniformative scatter-plots (e.g. education (years) and vocabulary (score on 0-10 scale)). Only 21 distinct education values and 11 scores, so only 21 x 11 = 231 plotting positions. Jittering data adds a small random quantity to each value to try to separate over-plotted points. Can vary the amount of jittering and also plot a smoother. Fox, 2002
Bivariate density estimation and scatter-plots Large data-sets and weak relationships between variables. Improve plot by jittering and making symbols smaller and apply bivariate kernel-density estimate plus regression line and LOWESS smoother. Fox, 2002
coal-fired power station oil-fired power station Diagonal = density estimate for each variable
The Bagplot: A Bivariate Boxplot Peter J. Rousseeuw The American Statistician November 1999, Vol. 53, No. 4, 382 Car weight and engine displacement of 60 cars.
Part (a) shows the concentrations of cholesterol and triglycerides in the plasma of 320 patients. In part (b) logarithms are taken of both variables. Part (a) shows the altitudinal range and abundance of butterflies. In part (b) the logarithm of the abundance is plotted.
Bagplot matrix of the three-dimensional aquifer data with 85 data points.
Conditioning plots (Co-plots) Focus on relationship between response and a predictor variable, holding other predictors constant at particular values – conditionally fixing the values of other predictors. 'Statistical control' Co-plots provide graphical statistical control. Focus on particular predictor and set each other predictor to a relatively narrow range (if quantitative) or to a specific value (if categorical). Subranges for a quantitative predictor are typically set to overlap (called "shingles") rather than to partition data into disjoint subsets ("bins").
For each combination of values of the conditioning predictors, construct scatter-plot to show response to the local predictor and arrange the plots in an array. Can condition on more than one predictor (e.g. age, gender). Six overlapping age classes, two genders (male upper, female lower), LOWESS, and linear fits Fox, 2002
EDA and Data-Transformations Try to linearise non-linear relationships by trial-and-error. Mosteller & Tukey's 'bulging rule'. When bulge points down, transform y down the ladder of powers and roots; when the bulge points up, transform y up, when the bulge points left, transform x down; when the bulge points right transform x up. Fox, 2002
Infant mortality rate and GDP per capita for 193 countries Log transformation linearising, variables more symmetric Points down and to left, try powers and roots Fox, 2002
Simple multivariate data Profiles, Stars, Glyphs, Faces, and Boxes of Percentages of Republican Votes in Six Presidential Elections in Six Southern States. The circles in the Stars Are Drawn at 50%. The Assignment of Variables to Facial Features in the Faces is: 1932 – Shape of Face; 1936 – Length of nose; 1940 – Curvature of Mouth; 1960 – Width of Mouth; 1964 – Slant of Eyes; 1968 – Length of Eyebrows
Three types of shape for representing multivariate data. In these examples glyph, stars and faces represent five, six and twelve (!) variables respectively. Frequency of the six commonest species on the Park Grass plots using star displays.
Labelled polygon plot Polygon plots
Chernoff faces CHERNOFF
Atlanta • Boston • Chicago • Dallas • Denver • Detroit • Hartford • Honolulu • Houston • Kansas City • Los Angeles • New Orleans • New York • Portland • Tucson • Washington Faces representation of city crime data CHERNOFF