Download

1 / 24
240 likes | 350 Views
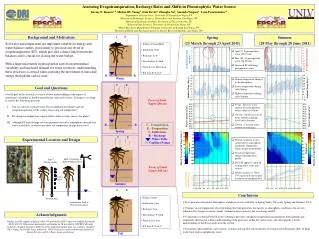
Background and Motivation. ENSO (El Niño Southern Oscillation). ENSO is classified in three states: Warm (El Niño) Neutral Cool (La Niña). A Warm ENSO year :.

E N D
ENSO (El Niño Southern Oscillation) • ENSO is classified in three states: • Warm (El Niño) • Neutral • Cool (La Niña) A Warm ENSO year: the water year for which the December to February Sea Surface Temperature in the NINO 3.4 region exceeds 0.5 standard deviations above its long-term (1900-1996) mean value.
The effects of ENSOon PNWwinter climate Source: Climate Impacts Group website Warm ENSO (El Niño) : winters tend to be warmer and drier than average. Cool ENSO (La Niña) : winters tend to be cooler and wetter than average.
Bonners Ferry Columbia Falls The Dalles - Warm ENSO - Neutral ENSO X - Cool ENSO The effects of ENSO on flood risk for Columbia River Basin
Refill Flood Control Objective: • Develop ENSO conditioned Flood Control Curves by Rebalancing Flood Control and Reservoir Refill
Bonners Ferry Columbia Falls The Dalles Test Case: The Columbia River Basin Multi-objective Reservoir System • Flood Control • Hydropower • Instream Flow • Water Supply • Recreation • Navigation
Optimization Model Develop Optimized Flood Control Curves Method : Optimization – Simulation Method Hydrologic Model Generate Streamflow for 20th Century Simulation Model Test and Refine Proposed Rule Curves
VIC Hydrologic Model (Variable Infiltration Capacity Hydrologic Model) • Macroscale Hydrologic Model developed by University of Washington which simulates energy and water balance at large scale at 1/8 degree (Approximately 50 mi2/ Cell)
HEC-PRM (Hydrologic Engineering Center’s Prescriptive Model) • Optimization model developed by the US Army Corps of Engineers • Penalty functions are used to constrain the Columbia River basin system operation • Flood control penalties • Storage penalties
ColSim (Columbia Simulation Model) • Flood control • Hydropower • Irrigation • Instream flow • Navigation • Recreation
Evaluate Flood and Refill Statistics using Simulation for Each ENSO state Generate Optimized Flood Rule Curves for Each ENSO State Classify Water Years into Each ENSO State Select Penalty Functions for Each ENSO State Adjust Penalty functions Optimization Strategy
Bonners Ferry Columbia Falls The Dalles - Warm ENSO - Neutral ENSO X - Cool ENSO
Bonners Ferry Columbia Falls The Dalles - Warm ENSO
- Current Flood Control Curves - HEC Flood Control Curves X - ENSO Flood Control Curves Flood Frequency Analysis at Bonners Ferry Warm ENSO Neutral ENSO Cool ENSO
- Current Flood Control Curves - HEC Flood Control Curves X - ENSO Flood Control Curves Flood Frequency Analysis at Columbia Falls Neutral ENSO Warm ENSO Cool ENSO
- Current Flood Control Curves - HEC Flood Control Curves X - ENSO Flood Control Curves Flood Frequency Analysis at The Dalles Warm ENSO Neutral ENSO Cool ENSO
Storage Deficits Warm ENSO Neutral ENSO Cool ENSO
Flood Control Curves vs. Simulated Storage (a low flow year)
Flood Control Curves vs. Simulated Storage (a high flow year)
Conclusions ENSO conditioned FC rule curves yield lower storage deficits than Current FC without significantly increasing flood risks ENSO FC is successfully calibrated using ENSO conditioned flood frequency curves and storage deficit statistics even though each ENSO category has relatively small sample size.
Conclusions • ENSO conditioned FC rule curves yield reduced storage deficits relative to HEC FC • There is no effect of reduced flood space on storage deficits for low flow years because flood control is not the main driver in low flow years.
Conclusions • ENSO conditioned FC rule curves yield reduced storage deficits relative to HEC FC • There is no effect of reduced flood space on storage deficits for low flow years because flood control is not the main driver in low flow years.