Download
1 / 1
10 likes | 121 Views
The 29 th CDPW, Madison, Wisconsin, Oct. 18-22, 2004. Global Land Surface Memory and Its Impacts Yun Fan, Huug van den Dool & Peitao Peng CPC/NCEP/NOAA. http://www.cpc.ncep.noaa.gov/soilmst/index.htm. 1. Motivation & Background. 4. Temporal & spatial evolution. 5.

E N D
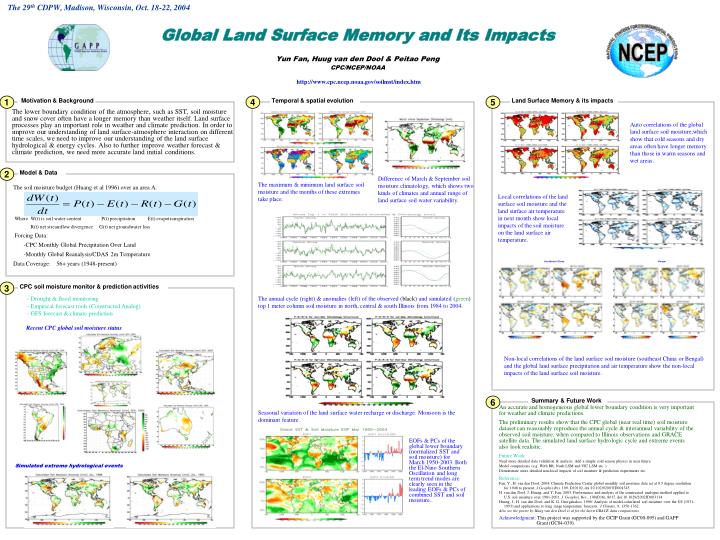
The 29th CDPW, Madison, Wisconsin, Oct. 18-22, 2004 Global Land Surface Memory and Its Impacts Yun Fan, Huug van den Dool & Peitao Peng CPC/NCEP/NOAA http://www.cpc.ncep.noaa.gov/soilmst/index.htm 1 Motivation & Background 4 Temporal & spatial evolution 5 Land Surface Memory & its impacts The lower boundary condition of the atmosphere, such as SST, soil moisture and snow cover often have a longer memory than weather itself. Land surface processes play an important role in weather and climate prediction. In order to improve our understanding of land surface-atmosphere interaction on different time scales, we need to improve our understanding of the land surface hydrological & energy cycles. Also to further improve weather forecast & climate prediction, we need more accurate land initial conditions. Auto correlations of the global land surface soil moisture,which show that cold seasons and dry areas often have longer memory than those in warm seasons and wet areas. 2 Model & Data Difference of March & September soil moisture climatology, which shows two kinds of climates and annual range of land surface soil water variability. The soil moisture budget (Huang et al 1996) over an area A: Where W(t) is soil water content P(t) precipitation E(t) evapotranspiration R(t) net streamflow divergence G(t) net groundwater loss Forcing Data: -CPC Monthly Global Precipitation Over Land -Monthly Global Reanalysis/CDAS 2m Temperature Data Coverage: 56+ years (1948-present) The maximum & minimum land surface soil moisture and the months of these extremes take place. Local correlations of the land surface soil moisture and the land surface air temperature in next month show local impacts of the soil moisture on the land surface air temperature. 3 CPC soil moisture monitor & prediction activities • Drought & flood monitoring • Empirical forecast tools (Constructed Analog) • GFS forecast & climate prediction • Recent CPC global soil moisture status The annual cycle (right) & anomalies (left) of the observed (black) and simulated (green) top 1 meter column soil moisture in north, central & south Illinois from 1984 to 2004. Non-local correlations of the land surface soil moisture (southeast China or Bengal) and the global land surface precipitation and air temperature show the non-local impacts of the land surface soil moisture. 6 Summary & Future Work An accurate and homogeneous global lower boundary condition is very important for weather and climate predictions. The preliminary results show that the CPC global (near real time) soil moisture dataset can reasonably reproduce the annual cycle & interannual variability of the observed soil moisture, when compared to Illinois observations and GRACE satellite data. The simulated land surface hydrologic cycle and extreme events also look realistic. Future Work Need more detailed data validation & analysis. Add a simple cold season physics in near future. Model comparisons (e.g. With RR, Noah LSM and VIC LSM etc. ). Demonstrate more detailed non-local impacts of soil moisture & prediction experiments etc. Reference: Fan, Y., H. van den Dool, 2004: Climate Prediction Center global monthly soil moisture data set at 0.5 degree resolution for 1948 to present. J.Geophys.Res. 109, D10102, doi:10.1029/2003JD004345 H. van den Dool, J. Huang, and Y. Fan, 2003: Performance and analysis of the constructed analogue method applied to U.S. soil moisture over 1981-2001. J. Geophys. Res., 108(D16), 8617, doi:10.1029/2002JD003114 Huang, J., H. van den Dool, and K. G. Georgakakos, 1996: Analysis of model-calculated soil moisture over the US (1931- 1993) and applications to long range temperature forecasts. J.Climate, 9, 1350-1362. Also see the poster by Huug van den Dool et al for the latest GRACE data comparisons. Acknowledgment: This project was supported by the GCIP Grant (GC00-095) and GAPP Grant (GC04-039). Seasonal variation of the land surface water recharge or discharge. Monsoon is the dominant feature. EOFs & PCs of the global lower boundary (normalized SST and soil moisture) for March 1950-2003. Both the El-Nino Southern Oscillation and long term trend modes are clearly seen in the leading EOFs & PCs of combined SST and soil moisture.. Simulated extreme hydrological events