Download
1 / 1
20 likes | 97 Views
Detecting and Understanding Changes in Molecular Aggregation Properties of Cyclic Diphenylalanine Assemblies Using Polarised Raman Spectroscopy. M. Hedegaard 123 , Lise T. de Jonge 12 , Becky Bank- Srour 4 , Gil Rosenman 4 , Søren Hassing 1 , M.M . Stevens 23

E N D
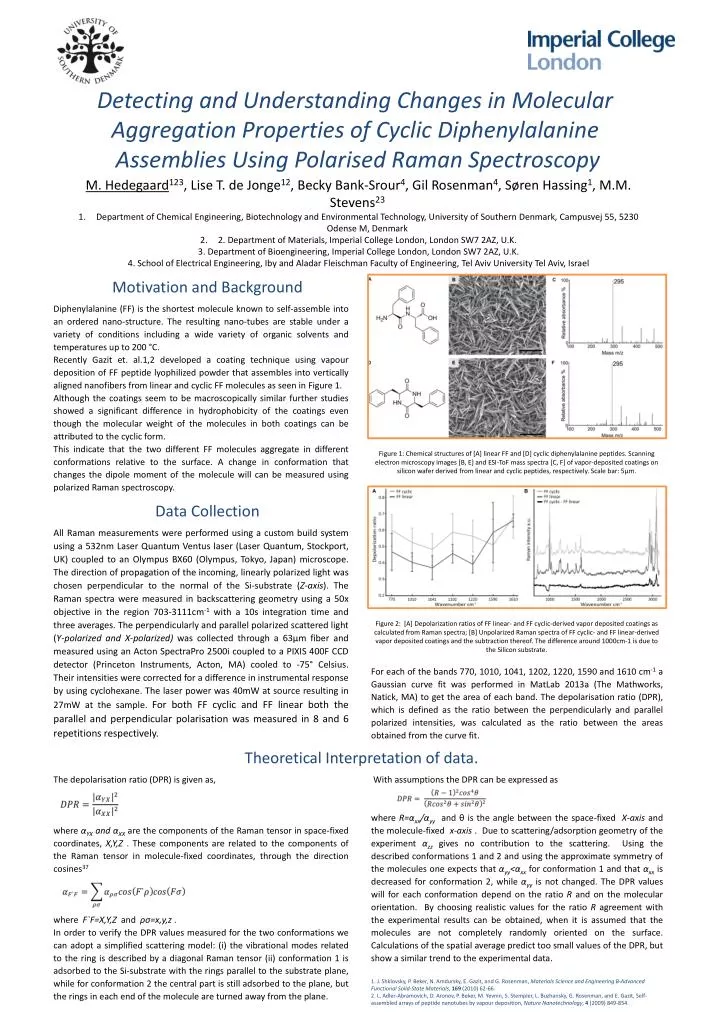
Detecting and Understanding Changes in Molecular Aggregation Properties of Cyclic Diphenylalanine Assemblies Using Polarised Raman Spectroscopy M. Hedegaard123, Lise T. de Jonge12, Becky Bank-Srour4, Gil Rosenman4, SørenHassing1, M.M. Stevens23 Department of Chemical Engineering, Biotechnology and Environmental Technology, University of Southern Denmark, Campusvej 55, 5230 Odense M, Denmark 2. Department of Materials, Imperial College London, London SW7 2AZ, U.K. 3. Department of Bioengineering, Imperial College London, London SW7 2AZ, U.K. 4. School of Electrical Engineering, Iby and Aladar Fleischman Faculty of Engineering, Tel Aviv University Tel Aviv, Israel Motivation and Background Diphenylalanine (FF) is the shortest molecule known to self-assemble into an ordered nano-structure. The resulting nano-tubes are stable under a variety of conditions including a wide variety of organic solvents and temperatures up to 200 °C. Recently Gazit et. al.1,2 developed a coating technique using vapour deposition of FF peptide lyophilized powder that assembles into vertically aligned nanofibersfrom linear and cyclic FF molecules as seen in Figure 1. Although the coatings seem to be macroscopically similar further studies showed a significant difference in hydrophobicity of the coatings even though the molecular weight of the molecules in both coatings can be attributed to the cyclic form. This indicate that the two different FF molecules aggregate in different conformations relative to the surface. A change in conformation that changes the dipole moment of the molecule will can be measured using polarized Raman spectroscopy. Figure 1: Chemical structures of [A] linear FF and [D] cyclic diphenylalanine peptides. Scanning electron microscopy images [B, E] and ESI-ToF mass spectra [C, F] of vapor-deposited coatings on silicon wafer derived from linear and cyclic peptides, respectively. Scale bar: 5μm. Data Collection All Raman measurements were performed using a custom build system using a 532nm Laser Quantum Ventus laser (Laser Quantum, Stockport, UK) coupled to an Olympus BX60 (Olympus, Tokyo, Japan) microscope. The direction of propagation of the incoming, linearly polarized light was chosen perpendicular to the normal of the Si-substrate (Z-axis). The Raman spectra were measured in backscattering geometry using a 50x objective in the region 703-3111cm-1 with a 10s integration time and three averages. The perpendicularly and parallel polarized scattered light (Y-polarized and X-polarized) was collected through a 63µm fiber and measured using an Acton SpectraPro 2500i coupled to a PIXIS 400F CCD detector (Princeton Instruments, Acton, MA) cooled to -75° Celsius. Their intensities were corrected for a difference in instrumental response by using cyclohexane. The laser power was 40mW at source resulting in 27mW at the sample. For both FF cyclic and FF linear both the parallel and perpendicular polarisation was measured in 8 and 6 repetitions respectively. Figure 2: [A] Depolarization ratios of FF linear- and FF cyclic-derived vapor deposited coatings as calculated from Raman spectra; [B] Unpolarized Raman spectra of FF cyclic- and FF linear-derived vapor deposited coatings and the subtraction thereof. The difference around 1000cm-1 is due to the Silicon substrate. For each of the bands 770, 1010, 1041, 1202, 1220, 1590 and 1610 cm-1 a Gaussian curve fit was performed in MatLab 2013a (The Mathworks, Natick, MA) to get the area of each band. The depolarisation ratio (DPR), which is defined as the ratio between the perpendicularly and parallel polarized intensities, was calculated as the ratio between the areas obtained from the curve fit. The depolarisation ratio (DPR) is given as, where αYX and αXX are the components of the Raman tensor in space-fixed coordinates, X,Y,Z . These components are related to the components of the Raman tensor in molecule-fixed coordinates, through the direction cosines37 where F`F=X,Y,Z and ρσ=x,y,z . In order to verify the DPR values measured for the two conformations we can adopt a simplified scattering model: (i) the vibrational modes related to the ring is described by a diagonal Raman tensor (ii) conformation 1 is adsorbed to the Si-substrate with the rings parallel to the substrate plane, while for conformation 2 the central part is still adsorbed to the plane, but the rings in each end of the molecule are turned away from the plane. Theoretical Interpretation of data. With assumptions the DPR can be expressed as where R=αxx/αyy and θ is the angle between the space-fixed X-axis and the molecule-fixed x-axis . Due to scattering/adsorption geometry of the experiment αzz gives no contribution to the scattering. Using the described conformations 1 and 2 and using the approximate symmetry of the molecules one expects that αyy<αxx for conformation 1 and that αxx is decreased for conformation 2, while αyyis not changed. The DPR values will for each conformation depend on the ratio R and on the molecular orientation. By choosing realistic values for the ratio R agreement with the experimental results can be obtained, when it is assumed that the molecules are not completely randomly oriented on the surface. Calculations of the spatial average predict too small values of the DPR, but show a similar trend to the experimental data. • 1. J. Shklovsky, P. Beker, N. Amdursky, E. Gazit, and G. Rosenman, Materials Science and Engineering B-Advanced Functional Solid-State Materials, 169 (2010) 62-66. • 2. L. Adler-Abramovich, D. Aronov, P. Beker, M. Yevnin, S. Stempler, L. Buzhansky, G. Rosenman, and E. Gazit, Self-assembled arrays of peptide nanotubes by vapour deposition, Nature Nanotechnology, 4 (2009) 849-854.