Download
1 / 35
360 likes | 494 Views
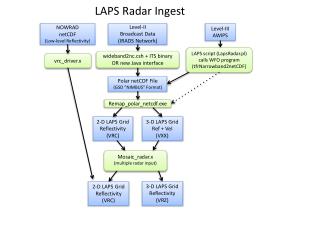
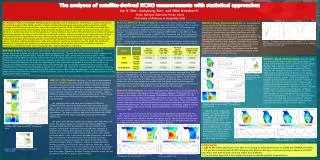
The Fusion of Radar Data and Satellite Imagery With Other Information in the LAPS Analyses. Steve Albers April 15, 2002. LAPS radar ingest. Remapping Strategy. Polar to Cartesian Average Z,V of all gates directly illuminating each grid point QC checks applied

E N D
The Fusion of Radar Data and Satellite Imagery With Other Information in the LAPS Analyses Steve Albers April 15, 2002
Remapping Strategy • Polar to Cartesian • Average Z,V of all gates directly illuminating each grid point • QC checks applied • Typically produces sparse arrays at this stage
Remapping Strategy (reflectivity) • Horizontal Analysis/Filter (Reflectivity) • Needed for medium/high resolutions (<5km) at distant ranges • Replace unilluminated points with average of immediate grid neighbors (from neighboring radials) • Equivalent to Barnes weighting at medium resolutions (~5km) • Extensible to Barnes for high resolutions (~1km) • Vertical Gap Filling (Reflectivity) • Linear interpolation to fill gaps up to 2km • Fills in below radar horizon & visible echo
Horizontal Filter/Analysis Before After
Mosaicing Strategy (reflectivity) • Nearest radar with valid data used • +/- 10 minute time window • Final reflectivity field produced within cloud analysis • Wideband is combined with Level-III (NOWRAD/NEXRAD) • QC checks including satellite • Help reduce AP and ground clutter
LAPS cloud analysis METAR METAR METAR
Surface Precipitation Accumulation • Algorithm similar to NEXRAD PPS, but runs in Cartesian space • Rain / Liquid Equivalent • Z = 200 R ^ 1.6 • Snow case: use rain/snow ratio dependent on column maximum temperature • Reflectivity limit helps reduce bright band effect
Future Cloud / Radar analysis efforts • Account for evaporation of radar echoes in dry air • Sub-cloud base for NOWRAD • Below the radar horizon for full volume reflectivity • Processing of multiple radars and radar types • Evaluate Ground Clutter / AP rejection
Future Cloud/Radar analysis efforts (cont) • Consider Terrain Obstructions • Improve Z-R Relationship • Convective vs. Stratiform • Precipitation Analysis • Improve Sfc Precip coupling to 3D hydrometeors • Combine radar with other data sources • Model First Guess • Rain Gauges • Satellite Precip Estimates (e.g. GOES/TRMM)
Cloud/Satellite Analysis Additions • 3.9 micron data • Improving visible with terrain albedo database • CO2-Slicing method (Cloud-top pressure)
3.9 micron imagery • Difference of 3.9/11 micron detects stratus at night • Works with 11 micron cloud-tops for cloud building • Probably useful for cloud-clearing • Difference of 3.9/11 micron detects clouds in the daytime? • Visible may be similar in cloud masking properties • Visible may be easier for obtaining a cloud fraction • Cloud Phase? • Works from 3.9/11 micron difference at night • Cloud-top phase needs blending throughout LWC/ICE column
Visible Satellite • Improving visible with terrain albedo database • current analysis only does cloud-clearing • Accurate sfc albedo can work with VIS + 11 micron cloud-tops for cloud building
CO2 Slicing Method (cloud-top P) • Subset of NESDIS Cloud-Top Pressure data • CO2 measurements add value • 11u measurements redundant with imagery • Treat as a “cloud sounding” similar to METARs and PIREPs
Selected references • Albers, S., 1995: The LAPS wind analysis. Wea. and Forecasting, 10, 342-352. • Albers, S., J. McGinley, D. Birkenheuer, and J. Smart, 1996: The Local Analysis and prediction System (LAPS): Analyses of clouds, precipitation and temperature. Wea. and Forecasting, 11, 273-287. • Birkenheuer, D., B.L. Shaw, S. Albers, E. Szoke, 2001: Evaluation of local-scale forecasts for severe weather of July 20, 2000. Preprints,14th Conf on Numerical Wea. Prediction, Ft. Lauderdale, FL, Amer. Meteor. Soc. • Cram, J.M.,Albers, S., and D. Devenyi, 1996: Application of a Two-Dimensional Variational Scheme to a Meso-beta scale wind analysis. Preprints, 15th Conf on Wea. Analysis and Forecasting, Norfolk, VA, Amer. Meteor. Soc. • McGinley, J., S. Albers, D. Birkenheuer, B. Shaw, and P. Schultz, 2000: The LAPS water in all phases analysis: the approach and impacts on numerical prediction. Presented at the 5th International Symposium on Tropospheric Profiling, Adelaide, Australia. • Schultz, P. and S. Albers, 2001: The use of three-dimensional analyses of cloud attributes for diabatic initialization of mesoscale models. Preprints,14th Conf on Numerical Wea. Prediction, Ft. Lauderdale, FL, Amer. Meteor. Soc.
Future LAPS analysis work • Surface obs QC • Operational use of Kalman filter (with time-space conversion) • Handling of surface stations with known bias • Improved use of radar data for AWIPS • Multiple radars • Wide-band full volume scans • Use of Doppler velocities • Obtain observation increments just outside of domain • Implies software restructuring • Add SST to surface analysis • Stability indices • Wet bulb zero, K index, total totals, Showalter, LCL (AWIPS) • LI/CAPE/CIN with different parcels in boundary layer • new (SPC) method for computing storm motions feeding to helicity determination • More-generalized vertical coordinate?
Recent analysis improvements • More generalized 2-D/3-D successive correction algorithm • Utilized on 3-D wind/temperature, most surface fields • Helps with clustered data having varying error characteristics • More efficient for numerous observations • Tested with SMS • Gridded analyses feed into variational balancing package • Cloud/Radar analysis • Mixture of 2D (NEXRAD/NOWRAD low-level) and 3D (wide-band volume radar) • Missing radar data vs “no echo” handling • Horizontal radar interpolation between radials • Improved use of model first guess RH &cloud liq/ice
Cloud type diagnosis Cloud type is derived as a function of temperature and stability