Download
1 / 1
10 likes | 92 Views
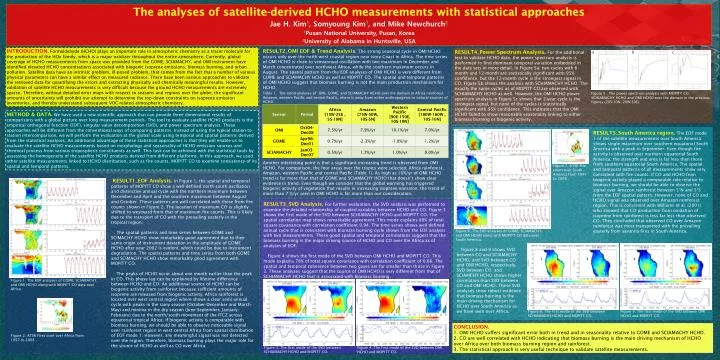
The analyses of satellite-derived HCHO measurements with statistical approaches Jae H. Kim 1 , Somyoung Kim 1 , and Mike Newchurch 2 1 Pusan National University, Pusan, Korea 2 University of Alabama in Huntsville, USA.

E N D
The analyses of satellite-derived HCHO measurements with statistical approaches Jae H. Kim1, Somyoung Kim1, and Mike Newchurch2 1Pusan National University, Pusan, Korea 2University of Alabama in Huntsville, USA INTRODUCTION.Formaldehyde (HCHO) plays an important role in atmospheric chemistry as a tracer molecule for the production of the HOx family, which is a major oxidizer throughout the entire atmosphere. Currently, global coverage of HCHO measurements from space was provided from the GOME, SCIAMACHY, and OMI instrument have identified elevated HCHO concentrations associated with biogenic isoprene emissions, biomass burning, and urban pollution. Satellite data have an intrinsic problem, ill-posed problem, that comes from the fact that a number of various physical parameters can have a similar effect on measured radiance. There have been various approaches to validate the retrieved data for quantifying the errors and extracting physically and chemically meaningful results. However, validation of satellite HCHO measurements is very difficult because the ground HCHO measurements are extremely sparse. Therefore, without detailed error maps with respect to seasons and regions over the globe, the significant amounts of uncertainty will prohibit our attempt to determine the top-down constraints on isoprene emission inventories, and thereby understand subsequent VOC-related atmospheric chemistry. RESULT2_OMI EOF & Trend Analysis.The strong seasonal cycle in OMI HCHO occurs only over the north-west coastal region near Ivory Coast in Africa. The time series of OMI HCHO is close to semiannual oscillation with two maximum in December and March concentrated over northwest Africa, while the southern maximum occurs in August. The spatial pattern from the EOF analyses of OMI HCHO is very different from GOME and SCIAMACHY HCHO as well as MOPITT CO. The spatial and temporal patterns of OMI HCHO suggest that biomass burning is not the main production mechanism for HCHO. RESULT4_Power Spectrum Analysis. For the additional test to validate HCHO data, the power spectrum analysis is performed to find dominant temporal variation embedded in the data sets in more detail. In Figure 5a, two cycles with 6-month and 12-month are statistically significant with 95% confidence, but the 12-month cycle is the strongest signal in CO. Figure 5b shows the analysis with SCHIAMACHY HCHO. The exactly the same cycles as of MOPITT CO are observed with SCHIAMACHY HCHO as well. However, the OMI HCHO power spectrum analysis in Figure 5c shows that 2-year cycle is the strongest signal, but none of the cycles is statistically significant with 95% confidence. This indicates that the OMI HCHO failed to show reasonable seasonality linking to either biomass burning or biogenic activity. a b c Table 1. The trend analyses of OMI, GOME, and SCIAMACHY HCHO over the domain in Africa rainforest, Amazon, western Pacific and central Pacific, where is away from either anthropogenic or natural sources of HCHO . Figure 5 . The power spectrum analysis with MOPITT CO, SCHIAMACHY HCHO and OMI HCHO over the domain in the previous figures (20S-10N, 20W-50E). METHOD & DATA.We have used a new scientific approach that can provide three dimensional results of comparisons with a global picture over long measurement periods. The tool to evaluate satellite HCHO products is the empirical orthogonal function (EOF), singular value decomposition (SVD), and power spectrum analysis. These approaches will be different from the conventional ways of comparing patterns. Instead of using the typical station-to-station intercomparison, we will perform the evaluation at the global scale using temporal and spatial patterns derived from the statistical analyses. An additional advantage of these statistical approaches is that they will enable us to evaluate the satellite HCHO measurements based on morphology and seasonality of HCHO emission sources and chemical process from various tropospheric constituents as well. This task can be achieved with the statistical tools by assessing the homogeneity of the satellite HCHO products derived from different platforms. In this approach, we used other satellite measurements linked to HCHO distribution, such as fire counts, MOPITT CO to examine consistency of its spatial and temporal patterns. RESULT5_South America region. The EOF mode 1 of the satellite measurements over South America shows single maximum over southern equatorial South America with a peak in September. Even though fire activity is observed over northern equatorial South America, the strength and area is far less than those from southern equatorial South America. The spatial and temporal patterns of all measurements show very consistent with fire counts. If CO and HCHO from biogenic activity played a comparable role relative to biomass burning, we should be able to observe the signal over Amazon rainforest between 5°N and 5°S from the EOF spatial pattern. However, none of CO and HCHO signal was observed over Amazon rainforest region. This is consistent with Williams et al. (2001) who showed that CO production from oxidation of isoprene from rainforest is less far less than observed CO. They concluded that observed CO over Amazon rainforest was most transported with the prevailing easterly from savanna fires in South America. Another interesting point is that a significant increasing trend is observed from OMI HCHO. For comparison, the four areas over the tropics were selected; Africa rainforest, Amazon, western Pacific and central Pacific (Table 1). As high as 10%/yr of OMI HCHO trend is far more than that of GOME and SCIAMACHY HCHO that doesn’t show clear evidence in trend. Even though we consider that the global warming has triggered biogenic activity of vegetation that results in increasing isoprene emission, the trend of more than 7 %/yr seen in OMI HCHO is far more than our consideration. Figure 7. ATSR Fire count over South America from 1997 to 2008 . RESULT1_EOF Analysis.In Figure 1, the spatial and temporal patterns of MOPITT CO show a well-defined north-south oscillation and distinctive annual cycle with the northern maximum between December and April and the southern maximum between August and October. These patterns are well correlated with those from fire counts shown in Figure 2. The location of maximum CO is slightly shifted to westward from that of maximum fire counts. This is likely due to the transport of CO with the prevailing easterly in the tropical region. The spatial patterns and time series between GOME and SCIMACHY HCHO show remarkably good agreement due to their same origin of instrument deviation in the amplitude of GOME HCHO after year 2002 is evident, which could be due to instrument degradation. The spatial patterns and time series from both GOME and SCIMACHY HCHO show remarkably good agreement with MOPITT CO. The peaks of HCHO occur about one month earlier than the peak in CO. This phase lag can be explained by lifetime difference between HCHO and CO. An additional source of HCHO can be biogenic activity from rainforest because sufficient amounts of isoprene are released from biogenic activity. Africa rainforest is located over west central region where shows a clear semi-annual cycle with peaks in the rainy season (October-December and March-May) and minima in the dry season (June-September, January-February) due to the north/south movement of the ITCZ across equatorial tropical Africa. If biogenic activity is comparable with biomass burning, we should be able to observe noticeable signal over rainforest region in west central Africa from spatial distribution of EOF mode 1. However, any meaningful signal was not detected over the region. Therefore, biomass burning plays the major role for the source of HCHO as well as CO over Africa. RESULT3_SVD Analysis.For further evaluation, the SVD analysis was performed to examine the detailed relationship of coupled variables between HCHO and CO. Figure 3 shows the first mode of the SVD between SCHIAMACHY HCHO and MOPITT CO. The spatial correlation map shows remarkable agreement. This mode explains 80% of total square covariance with correlation coefficient 0.94. The time series shows well defined annual cycle that is consistent with biomass burning cycle shown from the EOF analysis with two measurements. These good spatial and temporal correlations suggest that the biomass burning is the major driving source of HCHO and CO over the Africa as of analyses of EOF. Figure 4 shows the first mode of the SVD between OMI HCHO and MOPITT CO. This mode explains 78% of total square covariance with correlation coefficient of 0.66. The spatial and temporal coherence between two gases are far smaller than those in Figure 3. These analyses suggest that the source of OMI HCHO is very different from that of SCHIAMACHY HCHO that is associated with biomass burning. Figure 6. The EOF analyses of GOME, SCIAMACHY, and OMI HCHO along with MOPITT CO data over South America. Figure 8 and 9 shows SVD between CO and SCIAMACHY HCHO, and SVD between CO and OMI HCHO, respectively. SVD between CO and SCIAMCHY HCHO shows higher correlation than SVD between CO and OMI HCHO. These SVD analyses show robust evidence that biomass burning is the main driving mechanism for HCHO over South America as we have seen over Africa. Figure 1. The EOF analyses of GOME, SCIAMACHY, and OMI HCHO along with MOPITT CO data over Africa. Figure 8. The first mode of the SVD between SCHIAMACHY HCHO and MOPITT CO. Figure 9. The first mode of the SVD between OMI HCHO and MOPITT CO. CONCLUSION. 1. OMI HCHO suffers significant error both in trend and in seasonality relative to GOME and SCIAMACHY HCHO. 2. CO are well correlated with HCHO indicating that biomass burning is the main driving mechanism of HCHO over Africa over both biomass burning region and rainforest. 3. The statistical approach is very useful technique to validate satellite measurements. Figure 2. ATSR Firec ount over Africa from 1997 to 2008 . Figure 3. The first mode of the SVD between SCHIAMACHY HCHO and MOPITT CO. Figure 4. The first mode of the SVD between OMI HCHO and MOPITT CO.