Download

1 / 37
380 likes | 590 Views
Geo-Spatial Virtual Environments Visualization of Geographical Information in 3D. Eduardo S. Dias FEWEB / SPIN lab edias@feweb.vu.nl. Index…. Introduction to cartography Why 3D Basic Maths Virtual Environments Visualization of terrains Applications. CARTOGRAPHY AND VISUALIZATION

E N D
Geo-Spatial Virtual EnvironmentsVisualization of Geographical Information in 3D Eduardo S. Dias FEWEB / SPINlab edias@feweb.vu.nl Visualization of Geographical Information in 3D, 27 June 2003
Index… • Introduction to cartography • Why 3D • Basic Maths • Virtual Environments • Visualization of terrains • Applications Visualization of Geographical Information in 3D, 27 June 2003
CARTOGRAPHY AND VISUALIZATION Graphical presentation of information has a long history, and some of the earliest extant graphical presentations are maps. Cartography has had, and continues to have, an important role to play in the graphical presentation of geospatial information Visualization of Geographical Information in 3D, 27 June 2003
CARTOGRAPHY AND VISUALIZATION Definition of Cartography The transformation that takes place when information is depicted in a way that can be perceived encouraging the senses to exploit the spatial structure of the portrayal as it is interpreted. The representations are usually graphical, but may also be haptic or audible, or involve elements that mix other senses with sight. Visualization of Geographical Information in 3D, 27 June 2003
Cognitive science (Role of media) The media used to help on the perception of spatial information may have four types of functions according to cognition science: · the function of demonstration, · the function of putting into context, · the function of construction, · the function of motivation. Visualization of Geographical Information in 3D, 27 June 2003
when developing a system to visualize and perceive spatial information Attention to cognitive processes of: · Short term memories limited cognitive capacity; · To increase important information; · To avoid the overload of a single sense; · To support double encoding if information. Visualization of Geographical Information in 3D, 27 June 2003
Why 3D visualization: • Provides an effective way of presenting large amounts of complex information to a wide audience, including those with no GIS or mapping experience. • It allows the user to relate the information to reality more easily and can give a realistic picture of future changes in the landscape. Visualization of Geographical Information in 3D, 27 June 2003
"I" factors in creating GeoVirtual environments: · Immersion, · Interactivity, · Information intensity, · Intelligence of objects Visualization of Geographical Information in 3D, 27 June 2003
Types of 3D 3D Digital Analogue Come back tothis one later Real representation Schematicdata 2,5 D Maps Examples Visualization of Geographical Information in 3D, 27 June 2003
Examples of 3D types • Real representation • Aerial photographs Visualization of Geographical Information in 3D, 27 June 2003
Examples of 3D types • Schematic data • Maps Visualization of Geographical Information in 3D, 27 June 2003
Textures • Bring realism to the objects • May add extra information Visualization of Geographical Information in 3D, 27 June 2003
Textures Visualization of Geographical Information in 3D, 27 June 2003
VIRTUAL ENVIRONMENTS • Non-immersive virtual reality: • Increasingly based on the Internet (www.web3d.org); • M screen • for broad audiences; • XL screen • Mobile • S screen Visualization of Geographical Information in 3D, 27 June 2003
OTHER SYNTHETIC EXPERIENCES • Role of sound: • To represent multidimensional data • To represent parameters that change in time • Outliers and extreme values can be highlighted • Locate sources of information that are outside of the field of view in VE’s Visualization of Geographical Information in 3D, 27 June 2003
OTHER SYNTHETIC EXPERIENCES • Haptic feedback • Force feedback • Feeling shapes and textures • www.sensable.com Visualization of Geographical Information in 3D, 27 June 2003
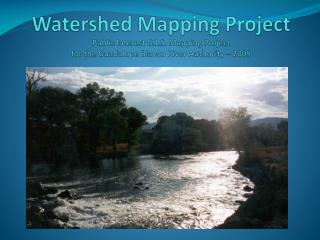
VISUALISATION OF TERRAINS • Digital Terrain Models draped with photo-textures • Rendering in real time applies Level-of-Detail Management (LOD) and wavelets Visualization of Geographical Information in 3D, 27 June 2003
INTERACTION WITH TERRAINS • Virtual reality based interfaces • Interoperability between geographical information systems (GIS) and virtual environments • Interfaces for virtual environments based on filters • Interfaces for virtual environments based on sketching Visualization of Geographical Information in 3D, 27 June 2003
Plan preparation communication tool Visualization of Geographical Information in 3D, 27 June 2003
Spatial planning more complicated • High-speed train network • Green ecological networks • Urban sprawl • New policies on agriculture • Environmental management • New airports Visualization of Geographical Information in 3D, 27 June 2003
Major risks • Spatial planning is only important for a very small part of the population • Plans which have democratic / political fiat can’t be implemented or with big delays • Gap between governmental bodies and people involved is widening Visualization of Geographical Information in 3D, 27 June 2003
Bridging the gap ? Visualization of Geographical Information in 3D, 27 June 2003
The bottom-lines of a “new” approach • Transparency to inhabitants and entreprises involved • High quality mapping of current and future situation • Realistic “real world” images • geo-information Infrastructure which support open plan process and participation Visualization of Geographical Information in 3D, 27 June 2003
Major goals • Build a fly-over tool with altitude constraints: the user cannot approach the ground • Include a dedicated interface with features such as pre-defined paths and pre-set points of interest (virtual sightseeing) • Include links to multimedia information • Include multiple layers for comparison purposes • Possibility of including CAD models Visualization of Geographical Information in 3D, 27 June 2003
elevation map flyover VIRTOOLS texture interface design Process • The demo has integrated textures from top views of the terrain with an elevation map and a customized user interface on top of the software VIRTOOLS Visualization of Geographical Information in 3D, 27 June 2003
Objectives Develop a VR Toolbox for rapid Spatial Planning application development and distribution. Stream Line Process INTERFACE CONFIGURATION DATA MANAGEMENT USER INTERACTION VR Toolbox Set of Components Performing Specific Procedures And tasks Virtual Landscape Viewer OUTPUT SOLUTIONS Visualization of Geographical Information in 3D, 27 June 2003
Development Environment • Limited Resources (time and budget) • Maximum flexibility • VR Toolkit: VirtoolsTM • Computer Graphic Primitives • Behavioral Server (Internet Server) • Web Player plug in • Easy to use (graphical programming) • Modular programming • Low cost solution Visualization of Geographical Information in 3D, 27 June 2003
Data Management Data Normalization Orthophotos Satellite images Digital Elevation Models (DEM) videos, images and sounds 3D Models NORMALISATION Simplification Commercial Tools Formats Virtools NMO GeoTIFF MP3, wav DEM Raw format Arc View 3DStudio, LightWave Photoshop GeoTIFF converter Selection Conversion Formatting Visualization of Geographical Information in 3D, 27 June 2003
Data Management Constructor CONSTRUCTOR MAPPER Geographical Image composition and splitting Internal Graphical Data Base Proprietary formats (DEM, terrain textures, layers) TERRAIN GENERATOR Create terrain pages (mesh + textures) Normalized Data SCENARIO GENERATOR Special Effects (fog, dynamic textures) Object composition Multimedia linking Visualization of Geographical Information in 3D, 27 June 2003
Data Management Linker/Parser PARSER LINKER Internal Graphical Data Base • Key identifier: • Id (link to objects) • Geographical Coordinates (Link to spatial information) • Standard Data Forms • Visualization • Simulations External Data Base External Data Base … External Data Base Visual Landscape Viewer Visualization of Geographical Information in 3D, 27 June 2003
Interfaces • Graphical User Interfaces (2D & 3D elements) • Dynamic interface (content sensitive) • Sound and image recognition • Hardware interfaces • Security/Access restriction • Help (intelligent agents) Easy to use Intuitive Fun Visual Landscape Viewer Visualization of Geographical Information in 3D, 27 June 2003
User Interaction • Navigation (How to go…) • Paths, viewpoints, free-fly, fixed layer-fly; • Maps, buttons, shortcuts. • Visualization (Show me…) • Objects, Layers • Querying (Where is it…) • ID, • Simulation (What if…) • Raster (Cellular Automata), Vectorial (Object Oriented) Visual Landscape Viewer Visualization of Geographical Information in 3D, 27 June 2003
Visual Landscape Viewer • Structural Aspects • Information Layers • DEM • Textures (orthophotos) • 3D Models (buildings, layers) • Multimedia • Technology • LOD ------------ Wavelets • Paging ------------ Wavelets (Progressive loading) • Remote Server Distribution Management Output Solutions Visualization of Geographical Information in 3D, 27 June 2003
Output Module Intranet, Internet, CD-ROM • Professional • Planning • Public Participation • Interactive Planning • Interactive Discussion forums • Media • Dissemination/Communication • Interactive TV • Print (file and printer) • Reports (user action, Query results, Statistics) • Export interactive sections - VR Module (HMD, Cave, Augmented Reality) - Mobile access - High quality video output - Photo realistic Image rendering Visualization of Geographical Information in 3D, 27 June 2003
Conclusions • Communication Tool • Technology for the people • Open development process Edmundo Nobre FCT-UNL | YDreams | May 2003 Visualization of Geographical Information in 3D, 27 June 2003
Questions? • Hardware requirements? • Software requirements? • Geographic Data? • Implementation? Visualization of Geographical Information in 3D, 27 June 2003
“... the world portrayed on our information displays is caught up in the two-dimensionality of the endless flatlands of paper and videoscreen ... Escaping this flatland is the essential task of envisioning information - for all the interesting worlds (physical, biological, imaginary, human) that we seek to understand are inevitably and happily multivariate in nature. Not flatlands". E. R. Tufte (1990) Visualization of Geographical Information in 3D, 27 June 2003