Download
1 / 33
330 likes | 420 Views
Expansions to the National Air Quality Forecast Capability in 2007: Summary and analysis of performance April 8, 2008 Paula Davidson, Jeff McQueen, Rohit Mathur, Roland Draxler, Shobha Kondragunta, Scott Jackson, Ken Carey. Outline. Background, Current Products Recent Testing

E N D
Expansions to the National Air Quality Forecast Capability in 2007: Summary and analysis of performance April 8, 2008 Paula Davidson, Jeff McQueen, Rohit Mathur, Roland Draxler, Shobha Kondragunta, Scott Jackson, Ken Carey
Outline • Background, Current Products • Recent Testing • Examples: 2007 Cases • Looking Ahead
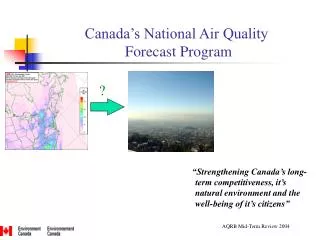
2005: O3 2007: O3,smoke National Air Quality Forecast CapabilityCurrent and Planned Capabilities, 4/08 • Improving the basis for AQ alerts • Providing AQ information for people at risk • FY08 Prediction Capabilities: • Operations: Ozone, expanded from EUS to CONUS, 9/07 Smoke implemented over CONUS, 3/07 • Experimental testing: Ozone upgrades Test smoke expansion over AK • Developmental testing: • components for particulate matter (PM) forecasts • Near-term Operational Targets: • Ozone, smoke coverage extended Nationwide • Longer range: • Quantitative PM2.5 prediction • Extend air quality forecast range to 48-72 hours • Include broader range of significant pollutants
AQI: Peak Oct 4 National Air Quality Forecast Capability End-to-End Operational Capability • Model Components: Linked numerical prediction system • Operationally integrated on NCEP’s supercomputer • NCEP mesoscale NWP: WRF-NMM • NOAA/EPA community model for AQ: CMAQ • Observational Input: • NWS weather observations; NESDIS fire locations • EPA emissions inventory • Gridded forecast guidance products • On NWS Telecommunications Gateway and EPA servers • Updated 2x daily • Verification basis • Ground-level AIRNow observations • Satellite smoke observations • Customer outreach/feedback • State & Local AQ forecasters coordinated with EPA • Public and Private Sector AQ constituents
Operational AQ forecast guidancewww.weather.gov/aq CONUS Ozone Expansion Implemented September, 2007 Smoke ProductsImplemented March, 2007 Further information: www.nws.noaa.gov/ost/air_quality
Recent Progress • Ozone Upgrades: Implemented Expanded Forecast Guidance for Coast-to-Coast (CONUS) domain in NWS operations 9/18/07 • 2007 upgrades in NAM and CMAQ • Improvements for CONUS and beyond • Smoke: Implemented into Operations 3/1/07 over CONUS • NAM and HYSPLIT/NAM transport: closer coupling • Fire emissions estimates from USFS (BlueSky) • Developing expanded coverage for AK • Aerosols: Developmental testing providing comprehensive dataset for diagnostic evaluations. (CONUS from mid-FY06) • CMAQ (aerosol option) • Qualitative; underprediction consistent with missing source inputs • R&D efforts in chemical data assimilation, real-time emissions sources, advanced chemical mechanisms
Phased Testing for Transition to Operations Phased Testing Research Does the science work? Key S&T Tests O3 -- Summer 2007 Developmental Testing Does it work with operational systems? More advanced PBL mixing in CMAQ (CB05) Experimental Testing Does it meet deployment readiness criteria? PBL mixing (ACM2) in CMAQ, CA off-road emissions, dry deposition upgrades Deploy into Operations NAM and emissions data updates; Plume rise correction
Model ImprovementsExperimental Upgrades to CMAQ, 2007 • Summer, 2006: CONUS experimental testing did not demonstrate required accuracy for western US • Identified severe underprediction of ozone in CA • Corrections: pollutant emissions, Aug 2006 – deficiencies remained. • Summer, 2007: Experimental Testing with upgraded configurations • Upgrades based on diagnostic analyses, retrospective testing. • Real-time testing/evaluation led to 2 minor corrections (Jul 22)
Objective Verification C • Domain-wide Performance meets Target • For 94/95 days tested. 1 miss, Aug 2: FC= 0.897 • Fraction Correct (FC), cum: 0.978 • Operational (EUS) cum: 0.986 • Regional Variations within Target • Eastern CONUS, FC = 0.980 • Western CONUS, FC = 0.969; So CA, FC = 0.906 • Poor AQ Episodes: • Examples July 3-8, August 14-16 • Patterns captured (next slides) Eastern US CONUS
Aug 14 FC= .946 Aug 15 FC= .926 Aug 16 FC= .946 Poor Air Quality Episode:August 14-16, 2007 • Experimental Predictions: • Accuracy (FC) above target but below average • Timing, location, of elevated ozone captured • In EUS, test guidance performance comparable to operational guidance
Upgrades in Testing, 4/08Case Study, August 2007 • fff Operational, Experimental: NAM upgrade (GWDG) Developmental: Adv chemistry (CB4aer, CB05)
August 2007 Case Study: Accuracy (A) CONUS Sub-Regions Averaged 8/6 – 8/20
Progress from 2005 to 2007:Ozone Prediction Summary Verification 2005 Initial Operational Capability (IOC) Operational, NE US Domain Operational EUS 2005 Experimental, Eastern US Approved 8/05 to replace IOC (NE US) in operations Experimental EUS 2006 Operational, Eastern US Operational EUS 2007 Experimental, Contiguous US Approved 9/07 to replace Eastern US config in operations Experimental CONUS
Smoke Forecast Tool: A step toward quantitative PM predictions • Required for particulate matter (PM) forecasts • Fire emissions significant source of fine particle pollution (PM2.5) • Direct (e.g. soot) and indirect (from secondary reactions) contributions • Large fires locally dominate PM • Challenges: how much and how far do fire emissions contribute to PM2.5? • Real-time information on fire emissions essential • Wildfire smoke sources too large and variable for success with inventory-based, climatological approximations • Effectively leverages existing capabilities • NOAA/NESDIS observations of fire locations, extent • USFS estimates for wildfire smoke emissions based on vegetation cover • NOAA/OAR expertise in dispersion prediction: HYSPLIT • Scalable for CONUS, North American and global domains as needed
Summary, Smoke Predictions: Warm Season, 2007 • TS cum = 0.159; Target = 0.08 (Column verification) • FC generally > 0.7 • FC Target not established for qualitative smoke tool • Based on satellite AOD; column verification only Andrea and the Florida/Georgia fires WonderBlog Post By: JeffMasters at 1:44 PM GMT on May 10, 2007 “The counter-clockwise circulation of air around Andrea's center of low pressure can be seen in the [NOAA} forecast movement of smoke …(Figure 1). The Hurricane Hunters reported that dense smoke was obscuring visibility over the ocean waters near Jacksonville during their mission into Andrea this morning--the first time I've ever seen that observation during a hurricane hunter mission. …”
Partnership with EPA, AQ forecasters:Examples: AQ Awareness Week, AQ outlook www.airnow.gov WATCH FOR IT! AIR QUALITY AWARENESS WEEK April 28- May 2, 2008
National Air Quality Forecast CapabilityLooking Ahead • Nationwide ozone and particulate matter predictions • Expanding ozone and smoke to nationwide coverage (ozone, smoke) and • Begin quantitative particulate matter predictions • Providing information Nationwide on when/where poor AQ is expected • Reducing losses to life (50,000) each year from poor AQ • Reducing economic losses ($150B each year) from poor AQ
Acknowledgments:AQF Implementation Team • OCWWS Jannie Ferrell Outreach, Feedback • OCIO Cindy Cromwell, Allan Darling, Bob Bunge Data Communications • OST/MDL Jerry Gorline Dev. Verification • OST/MDL Marc Saccucci, Tim Boyer, Dave Ruth NDGD Product Development • OST Ken Carey, Ivanka StajnerProgram Support • NESDIS/NCDC Alan Hall Product Archiving • NOAA/OARJim Meagher NOAA AQ Matrix Manager • NCEP • Jeff McQueen EMC AQF model team leader • Pius Lee System design and implementation • Marina Tsidulko PBL & Chem Verification • Youhua Tang Regional testing • Ho-Chun Huang Global dust/smoke system DT&E • *Sarah Lu Global data assimilation and feedback testing (NASA, NESDIS) • *Brad Ferrier, *Dan Johnson WRF retrospective run • *Eric Rogers, *Hui-Ya Chuang NAM products • Geoff Manikin Smoke Product testing and integration • John Ward, Brent Gordon, Dave Michaud NCO transition and systems testing * Guest Contributors • NOAA/OAR • Rohit Mathur ASMD AQF team leader • Daiwen Kang CMAQ verification, PM testing • Shaocai Yu CMAQ diagnostic studies • Hsin-Mu Lin, Tanya Otte PREMAQ development • Jon Pleim CMAQ met processing development • Jeff Young, David Wong Code optimization • George Pouliot, Daniel Tong Emissions processingOA • Ken Schere ASMD Science oversight • Roland Draxler, Glenn Rolph HYSPLIT adaptations • NOAA/NESDIS • Shobha Kondragunta, Jian Zeng Smoke Verification product development • George Stephens, Mark Ruminski HMS product integration with smoke forecast tool
US National AQF Capability:Looking Ahead • Expanding, Improving Ozone forecast guidance (WRF-CMAQ) • Closer coupling of AQ with WRF prediction; examine impacts of vertical resolution, vertical mixing treatments, horizontal boundary conditions… • Preliminary development of AK, HI capabilities • Testing over all 50 states with target operational implementation in FY10 • Extend forecast range to Day 2 and beyond • Developing Particulate matter components: • Smoke from large fires: experimental testing in AK, HI • Components for quantitative PM forecast capability: • Objective satellite products for verification (ongoing) • Aerosols predictions from anthropogenic source emissions in inventories: continued development/testing/analysis • Further component development, chemical data assimilation, dust, speciated fire emissions, “in-line” coupling of weather and AQ simulation • Developmental and experimental testing, integrated quantitative PM capability • Target operational implementation for initial PM forecasts, NE US: FY14
Continuing Science UpgradesImprovements to the expanding NAQFC • Continuing R&D required • OAR and EPA working actively with NWS to provide prototype capabilities for pre-operational development, testing experimental production, and implementation • Assuring quality with science peer reviews: • Design review of major system upgrades (initial, yearly upgrades) • Diagnostic evaluations with field campaigns and evaluations • Publication of T&E in peer-reviewed literature Ozone Capability • Otte et al. Weather and Forecasting, 20, 367-385 (2005) • Lee et al., J Applied Meteorology and Climatology, in press (2007) • Mckeen et al., J. Geophys. Res. 110, D21307 (2005) • Yu, et al. , J. Geophys. Res. (2007) Smoke Tool • Prados et al., J. Geophys. Res. 112, D15201 (2007) • Kondragunta et al., submitted for publication • Zeng and Kondragunta, ms. in preparation • Ruminski, Kondragunta, Draxler and Zeng, in preparation
Aug 15 FC= .930 Aug 16 FC= .933 Aug 14 FC= .968 Poor Air Quality episode:August 14-16, 2007, Operational Guidance • FC lower than average • Locations of predicted elevated ozone generally . captured, but areal extent too limited • Comparable performance to test guidance
Developmental Aerosol Predictions: Winter, 2006/7 March 14, 2007
Developmental Aerosol Predictions: 2007 August 3, 2007 August 5, 2007
National Air Quality Forecast CapabilityMajor Model Components: Ozone Predictions Weather Observations NWP Model NAM/WRF-NMM NOAA/NWS NOAA EPA NWP Post-processors for AQ Modules EPA’s National Emissions Inventory: EPA/OAQPS AQ Module: Emissions Preprocessor PREMAQ NOAA/OAR, NWS/NCEP, EPA/ORD IT /Comms NOAA/NWS and EPA/OAQPS AQ Module: Air Quality Reactive Transport CMAQ NOAA/OAR, NWS/NCEP,EPA/ORD
Smoke Forecast ToolMajor Components NOAA Weather Observations NWP Model NAM/WRF-NMM NOAA/NWS USFS NESDIS HMS Fire Locations NWP Post-processors for AQ Modules USFS’s BlueSky Emissions Inventory: USFS HYSPLIT Module: NOAA/OAR Verification: NESDIS/GASP Smoke
Expanded Ozone Forecast Guidance: Operational Readiness Criteria Summary C C C C C C C C * NESDIS automated ( objective) product
Smoke Forecast Tool: What is it? • Overview • Passive transport/dispersion computed with HYSPLIT & WRF-NAM (or GFS, OCONUS). 24-hr spin-up, 48-hour prediction made daily with 6Z cycle • Fire Locations • NESDIS/HMS: Filtered ABBA product (only fires with observed associated smoke) • Emissions • USFS’ BlueSky algorithm for emitted PM2.5 • Smoke Transport/dispersion • HYSPLIT (Lagrangian); plume rise based on combustion heat and meteorology • Verification • Based on satellite imagery for footprint of extent of observed smoke in atmospheric column exceeding threshold of detection
Smoke Forecast Tool • Fire Locations • Produced by NESDIS operational staff from satellite imagery • Only fires with observed associated smoke are used in calculation • Fires are noted as continuous or by a start time and duration • “Undetected” old fires decay at 75% / day with each new analysis • Fire intensities remain constant during the forecast period • Emissions • USFS’ BlueSky emissions algorithm gives rates for PM2.5 • Emission area is computed from the number of fire locations in a grid cell • Only 10% of each fire pixel (1 km2) is assumed to be burning • HYSPLIT Transport/Dispersion • Release height (Briggs) based on combustion heat from BlueSky and meteorology • Surface to 100m & surface to 5000m 1-hr avg PM2.5 concentrations on 15-km grid • Only continuous fires emit into the forecast period • The focus is on primary rather than secondary pollutants (age < 72 hrs) • Parameterized wet and dry deposition to reduce smoke concentrations
Smoke Forecast Tool: Model Configuration • Overview • Run daily at NCEP, 6Z cycle, to produce a 24-hr analysis and a 48-hr forecast • Transport & dispersion computed with HYSPLIT using WRF-NMM and GFS meteorology (outside the WRF-NMM domain) Computational Cycle All smoke particles and large fires initialize the next day’s calculation
Verification Approach: Smoke • Objective verification product developed for NWS: • First real-time verification for wildfire smoke in daily use • Based on NOAA/NESDIS satellite imagery: • GOES Aerosol Smoke Product (GASP) • Smoke from identified fires only • Filtered for interference: • Clouds, surface reflectance, solar angle, other aerosol • “Footprint” comparison: • Threshold concentration (1 µg/m3) for average smoke in the column • Tracking Threat scores, or Figure-of-merit statistics: (Area Pred Area Obs) / (Area Pred. U Area Obs) • Initial skill target set at 8%, checked with independent analysis in earlier methods: • Analysts isolate smoke in GOES-based NESDIS Hazards Mapping System (HMS)