Download
1 / 1
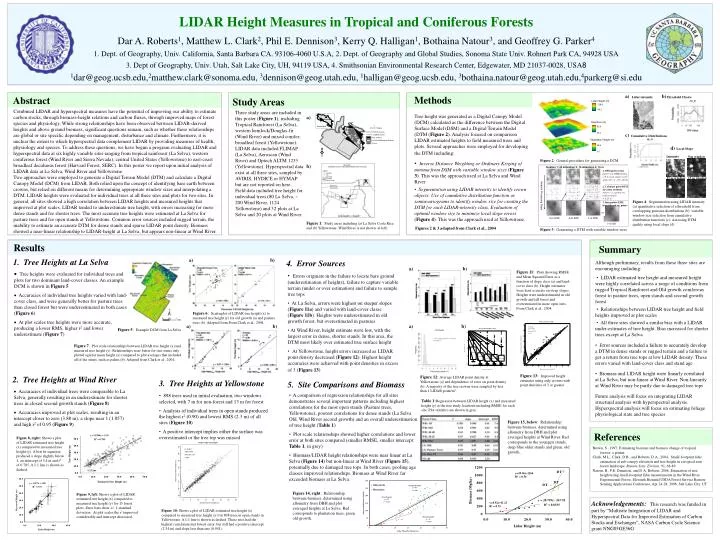
20 likes | 199 Views
Iteration 1: 20 m. Iteration 2: 15 m. Iteration 3: 10 m. 1. DSM grid overlay find 33-cm DSM minima cell in each coarse-scale grid cell (e.g., 20 x 20 m). 2. Calculate point-DTM elevation residuals remove x,y,z points (+) with residuals > 0.25 m. Iteration Processing Steps.

E N D
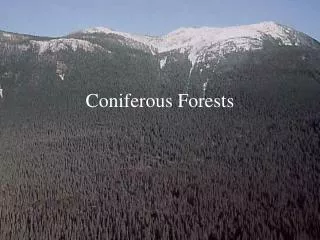
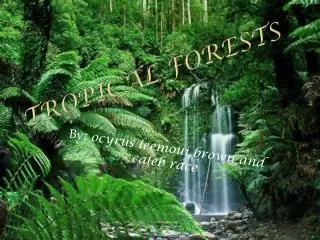
Iteration 1: 20 m Iteration 2: 15 m Iteration 3: 10 m 1. DSM grid overlay find 33-cm DSM minima cell in each coarse-scale grid cell (e.g., 20 x 20 m) 2. Calculate point-DTM elevation residuals remove x,y,z points (+) with residuals > 0.25 m Iteration Processing Steps 3. Interpolate DTM from filtered xyz points y=59.96x-1264 R2 = 0.56 or 5-m IDW 5-m IDW 1-m IDW Intensity 9 m window 1-m OK y=8.92x+11.21 R2 = 0.75 11 m window 13 m window Lidar Height (m) 128.8 45.2 Elevation (m) 92.6 45.2 Vegetation Height (m) 48.6 0.0 LIDAR Height Measures in Tropical and Coniferous Forests Dar A. Roberts1, Matthew L. Clark2, Phil E. Dennison3, Kerry Q. Halligan1, Bothaina Natour3, and Geoffrey G. Parker4 1. Dept. of Geography, Univ. California, Santa Barbara CA. 93106-4060 U.S.A, 2. Dept. of Geography and Global Studies, Sonoma State Univ. Rohnert Park CA, 94928 USA 3. Dept of Geography, Univ. Utah, Salt Lake City, UH, 94119 USA, 4. Smithsonian Environmental Research Center, Edgewater, MD 21037-0028, USA8 1dar@geog.ucsb.edu,2matthew.clark@sonoma.edu, 3dennison@geog.utah.edu, 1halligan@geog.ucsb.edu, 3bothaina.natour@geog.utah.edu,4parkerg@si.edu a) b) Methods Abstract Lidar intensity Threshold Choice Study Areas Combined LIDAR and hyperspectral measures have the potential of improving our ability to estimate carbon stocks, through biomass-height relations and carbon fluxes, through improved maps of forest species and physiology. While strong relationships have been observed between LIDAR-derived heights and above ground biomass, significant questions remain, such as whether these relationships are global or site specific depending on management, disturbance and climate. Furthermore, it is unclear the extent to which hyperspectral data complement LIDAR by providing measures of health, physiology and species. To address these questions, we have begun a program evaluating LIDAR and hyperspectral data at six highly variable sites ranging from tropical rainforest (La Selva), western coniferous forest (Wind River and Sierra Nevada), central United States (Yellowstone) to east-coast broadleaf deciduous forest (Harvard Forest, SERC). In this poster we report upon initial analysis of LIDAR data at La Selva, Wind River and Yellowstone. Two approaches were employed to generate a Digital Terrain Model (DTM) and calculate a Digital Canopy Model (DCM) from LIDAR. Both relied upon the concept of identifying bare earth between crowns, but relied on different means for determining appropriate window sizes and interpolating a DTM. LIDAR heights were evaluated for individual trees at all three sites and plots for two sites. In general, all sites showed a high correlation between LIDAR heights and measured heights that improved at plot scales. LIDAR tended to underestimate tree height, with errors increasing for more dense stands and for shorter trees. The most accurate tree heights were estimated at La Selva for pasture trees and for open stands at Yellowstone. Common error sources included rugged terrain, the inability to estimate an accurate DTM for dense stands and sparse LIDAR point density. Biomass showed a near-linear relationship to LIDAR-height at La Selva, but appears non-linear at Wind River. Three study areas are included in this poster (Figure 1), including Tropical Rainforest (La Selva), western hemlock/Douglas-fir (Wind River) and mixed conifer-broadleaf forest (Yellowstone). LIDAR data included FLIMAP (La Selva), Aeroscan (Wind River) and Optech ALTM 1233 (Yellowstone). Hyperspectral data exist at all three sites, sampled by AVIRIS, HYDICE or HYMAP but are not reported on here. Field data included tree height for individual trees (80 La Selva, ~ 200 Wind River, 1124 Yellowstone) and 32 plots at La Selva and 20 plots at Wind River. Tree height was generated as a Digital Canopy Model (DCM) calculated as the difference between the Digital Surface Model (DSM) and a Digital Terrain Model (DTM (Figure 2). Analysis focused on comparison LIDAR estimated heights to field measured trees and plots. Several approaches were employed for developing the DTM including: • Inverse Distance Weighting or Ordinary Kriging of minima from DSM with variable window sizes (Figure 3). This was the approach used at La Selva and Wind River • Segmentation using LIDAR intensity to identify crown objects. Use of cumulative distribution function or semiavariograms to identify window size for creating the DTM for each LIDAR-intensity class. Evaluation of optimal window size to minimize local slope errors (Figure 4). This was the approach used at Yellowstone. a) c) Cumulative Distributions d) Local Slope Figure 2: General procedure for generating a DCM b) Figure 4: Segmentation using LIDAR intensity (a) quantitative selection of a threshold from overlapping gaussian distributions (b); variable window size selection from cumulative distribution functions (c); Assessing DTM quality using local slope (d) Figure 1: Study areas including (a) La Selva Costa Rica and (b) Yellowstone. Wind River is not shown. at left). Figures 2 & 3 adapted from Clark et al., 2004 Figure 3: Generating a DTM with variable window sizes Results Summary 1. Tree Heights at La Selva a) b) 4. Error Sources Although preliminary, results from these three sites are encouraging including: • LIDAR estimated tree height and measured height were highly correlated across a range of conditions from rugged Tropical Rainforest and Old growth coniferous forest to pasture trees, open stands and second growth forest • Relationships between LIDAR tree height and field heights improved at plot scales • All three sites showed a similar bias with a LIDAR under-estimates of tree height. Bias increased for shorter trees except at La Selva • Error sources included a failure to accurately develop a DTM in dense stands or rugged terrain and a failure to get a return from tree tops at low LIDAR density. These errors varied with land-cover class and stand age • Biomass and LIDAR height were linearly correlated at La Selva, but non-linear at Wind River. Non-linearity at Wind River may be partly due to damaged tree tops Future analysis will focus on integrating LIDAR structural analysis with hyperspectral analysis. Hyperspectral analysis will focus on estimating foliage physiological state and tree species a) b) Figure 11:Plots showing RMSE and Mean Squared Error as a function of slope class (a) and land-cover class (b). Height estimates were least accurate on steep slopes. Heights were underestimated in old growth and tall forest and overestimated in more open sites. From Clark et al., 2004. • Tree heights were evaluated for individual trees and plots for two dominant land-cover classes. An example DCM is shown in Figure 5 • Accuracies of individual tree heights varied with land-cover class, and were generally better for pasture trees than closed forest but were underestimated in both cases (Figure 6) • At plot scales tree heights were more accurate, producing a lower RMS, higher r2 and lower underestimate (Figure 7) • Errors originate in the failure to locate bare ground (underestimation of heights), failure to capture variable terrain (under or over estimation) and failure to sample tree tops • At La Selva, errors were highest on steeper slopes (Figure 11a) and varied with land-cover classe (Figure 11b). Heights were underestimated in old growth forest, but overestimated in pastures • At Wind River, height estimate were low, with the largest error in dense, shorter stands. In this area, the DTM most likely over estimated true surface height • At Yellowstone, height errors increased as LIDAR point density decreased (Figure 12). Highest height accuracies were achieved with point densities in excess of 3 (Figure 13) Figure 6: Scatterplot of LIDAR tree height (x) to measured tree height (y) for old growth (a) and pasture trees (b). Adapted from From Clark et al., 2004. a) b) a) b) Figure 5: Example DCM from La Selva Figure 7: Plot scale relationships between LIDAR tree height (x) and measured tree height (y). Relationships were better for tree stems only plotted against mean height (a) compared to plot averages that included all of the stems, such as palms (b). Adapted from Clark et al., 2004. Figure 13:Improved height estimates using only crowns with point densities of 3 or greater 2. Tree Heights at Wind River Figure 12:Average LIDAR point density at Yellowstone (a) and dependence of error on point density (b). A majority of the tree crowns were sampled by less than 1 LIDAR point/m2. 3. Tree Heights at Yellowstone 5. Site Comparisons and Biomass • Accuracies of individual trees were comparable to La Selva, generally resulting in an underestimate for shorter trees in closed second growth stands (Figure 8) • Accuracies improved at plot scales, resulting in an intercept closer to zero (3.88 m), a slope near 1 (1.057) and high r2 of 0.95 (Figure 9) • 898 trees used in initial evaluation, two windows selected, with 7 m for non-forest and 13 m for forest • Analysis of individual trees in open stands produced the highest r2 (0.90) and lowest RMS (2.3 m) of all sites (Figure 10) • A positive intercept implies either the surface was overestimated or the tree top was missed • A comparison of regression relationships for all sites demonstrates several important patterns including highest correlations for the most open stands (Pasture trees, Yellowstone), poorest correlations for dense stands (La Selva Old, Wind River second growth) and an overall underestimation of tree height (Table 1) • Plot scale relationships showed higher correlations and lower error at both sites compared (smaller RMSE, smaller intercept: Table 1, in grey) • Biomass/LIDAR height relationships were near linear at La Selva (Figure 14) but non-linear at Wind River (Figure 15), potentially due to damaged tree tops. In both cases, pooling age classes improved relationships. Biomass at Wind River far exceeded biomass at La Selva. Table 1:Regression between LIDAR height (x) and measured height (y) at the tree study locations including RMSE for each site. Plot statistics are shown in grey. Figure 15, below: Relationship between biomass, determined using allometry from DBH and plot averaged heights at Wind River. Red corresponds to the youngest stands, deep blue older stands and green, old growth. References Figure 8, right: Shows a plot of LIDAR estimated tree height (x) compared to measured tree height (y). A best fit equation produced a slope slightly below 1, an intercept of 5.4 m and r2 of 0.785. A 1:1 line is shown as dashed. Brown, S., 1997,Estimating biomass and biomass change of tropical forests: a primer Clark, M.L., Clark, D.B., and Roberts, D.A., 2004, Small-footprint lidar estimation of sub-canopy elevation and tree height in a tropical rain forest landscape, Remote Sens. Environ. 91, 68-89 Natour, B., P.E. Dennison, and D.A. Roberts, 2006. Estimation of tree height using small-footprint lidar measurements in the Wind River Experimental Forest. Eleventh Biennial USDA Forest Service Remote Sensing Applications Conference, Apr 24-28, 2006, Salt Lake City, UT Figure 14, right: Relationship between biomass, determined using allometry from DBH and plot averaged heights at La Selva. Red corresponds to plantation trees, green old growth. Figure 9, left: Shows a plot of LIDAR estimated tree height (x) compared to measured tree height (y) for 15 forest plots. Error bars show +/- 1 standard deviation. At plot scales the r2 improved considerably and intercept decreased. Acknowledgements: This research was funded in part by “Multisite Integration of LIDAR and Hyperspectral Data for Improved Estimation of Carbon Stocks and Exchanges”, NASA Carbon Cycle Science grant NNG05GE56G Figure 10: Shows a plot of LIDAR estimated tree height (x) compared to measured tree height (y) for 898 trees in open stands in Yellowstone. A 1:1 line is shown as dashed. These sites had the highest correlation and lowest error, but still had a positive intercept (2.34 m) and slope less than one (0.941).