Download
1 / 1
10 likes | 133 Views
Height to DBH Ratio in N. Olympic Forests. Karsten Turrey, North Olympic Peninsula Skills Center Natural Resources. Prior Knowledge

E N D
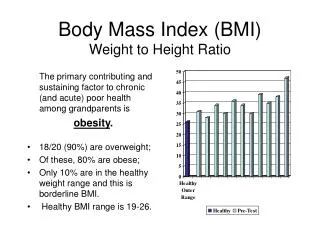
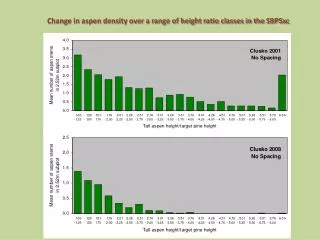
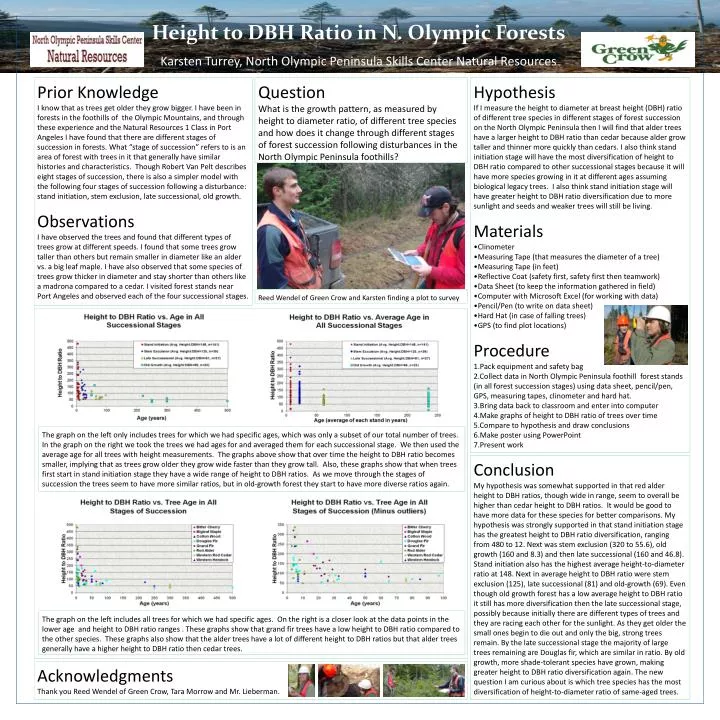
Height to DBH Ratio in N. Olympic Forests Karsten Turrey, North Olympic Peninsula Skills Center Natural Resources Prior Knowledge I know that as trees get older they grow bigger. I have been in forests in the foothills of the Olympic Mountains, and through these experience and the Natural Resources 1 Class in Port Angeles I have found that there are different stages of succession in forests. What “stage of succession” refers to is an area of forest with trees in it that generally have similar histories and characteristics. Though Robert Van Pelt describes eight stages of succession, there is also a simpler model with the following four stages of succession following a disturbance: stand initiation, stem exclusion, late successional, old growth. Observations I have observed the trees and found that different types of trees grow at different speeds. I found that some trees grow taller than others but remain smaller in diameter like an alder vs. a big leaf maple. I have also observed that some species of trees grow thicker in diameter and stay shorter than others like a madrona compared to a cedar. I visited forest stands near Port Angeles and observed each of the four successional stages. Question What is the growth pattern, as measured by height to diameter ratio, of different tree species and how does it change through different stages of forest succession following disturbances in the North Olympic Peninsula foothills? Hypothesis If I measure the height to diameter at breast height (DBH) ratio of different tree species in different stages of forest succession on the North Olympic Peninsula then I will find that alder trees have a larger height to DBH ratio than cedar because alder grow taller and thinner more quickly than cedars. I also think stand initiation stage will have the most diversification of height to DBH ratio compared to other successional stages because it will have more species growing in it at different ages assuming biological legacy trees. I also think stand initiation stage will have greater height to DBH ratio diversification due to more sunlight and seeds and weaker trees will still be living. Materials •Clinometer •Measuring Tape (that measures the diameter of a tree) •Measuring Tape (in feet) •Reflective Coat (safety first, safety first then teamwork) •Data Sheet (to keep the information gathered in field) •Computer with Microsoft Excel (for working with data) •Pencil/Pen (to write on data sheet) •Hard Hat (in case of falling trees) •GPS (to find plot locations) Procedure 1.Pack equipment and safety bag 2.Collect data in North Olympic Peninsula foothill forest stands (in all forest succession stages) using data sheet, pencil/pen, GPS, measuring tapes, clinometer and hard hat. 3.Bring data back to classroom and enter into computer 4.Make graphs of height to DBH ratio of trees over time 5.Compare to hypothesis and draw conclusions 6.Make poster using PowerPoint 7.Present work Reed Wendel of Green Crow and Karsten finding a plot to survey The graph on the left only includes trees for which we had specific ages, which was only a subset of our total number of trees. In the graph on the right we took the trees we had ages for and averaged them for each successional stage. We then used the average age for all trees with height measurements. The graphs above show that over time the height to DBH ratio becomes smaller, implying that as trees grow older they grow wide faster than they grow tall. Also, these graphs show that when trees first start in stand initiation stage they have a wide range of height to DBH ratios. As we move through the stages of succession the trees seem to have more similar ratios, but in old-growth forest they start to have more diverse ratios again. Conclusion My hypothesis was somewhat supported in that red alder height to DBH ratios, though wide in range, seem to overall be higher than cedar height to DBH ratios. It would be good to have more data for these species for better comparisons. My hypothesis was strongly supported in that stand initiation stage has the greatest height to DBH ratio diversification, ranging from 480 to 12. Next was stem exclusion (320 to 55.6), old growth (160 and 8.3) and then late successional (160 and 46.8). Stand initiation also has the highest average height-to-diameter ratio at 148. Next in average height to DBH ratio were stem exclusion (125), late successional (81) and old-growth (69). Even though old growth forest has a low average height to DBH ratio it still has more diversification then the late successional stage, possibly because initially there are different types of trees and they are racing each other for the sunlight. As they get older the small ones begin to die out and only the big, strong trees remain. By the late successional stage the majority of large trees remaining are Douglas fir, which are similar in ratio. By old growth, more shade-tolerant species have grown, making greater height to DBH ratio diversification again. The new question I am curious about is which tree species has the most diversification of height-to-diameter ratio of same-aged trees. The graph on the left includes all trees for which we had specific ages. On the right is a closer look at the data points in the lower age and height to DBH ratio ranges . These graphs show that grand fir trees have a low height to DBH ratio compared to the other species. These graphs also show that the alder trees have a lot of different height to DBH ratios but that alder trees generally have a higher height to DBH ratio then cedar trees. Acknowledgments Thank you Reed Wendel of Green Crow, Tara Morrow and Mr. Lieberman.