Download
1 / 1
10 likes | 136 Views
Vertical Structure Complexity Assessment of Tropical Forests from a Portable LiDAR System Amanda Cooper 1* , John Weishampel 1 , Jason Drake 2 , David Clark 3 , Geoffrey Parker 4

E N D
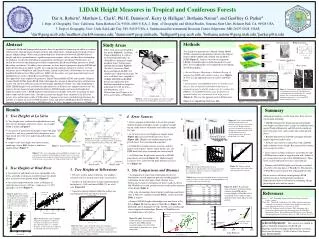
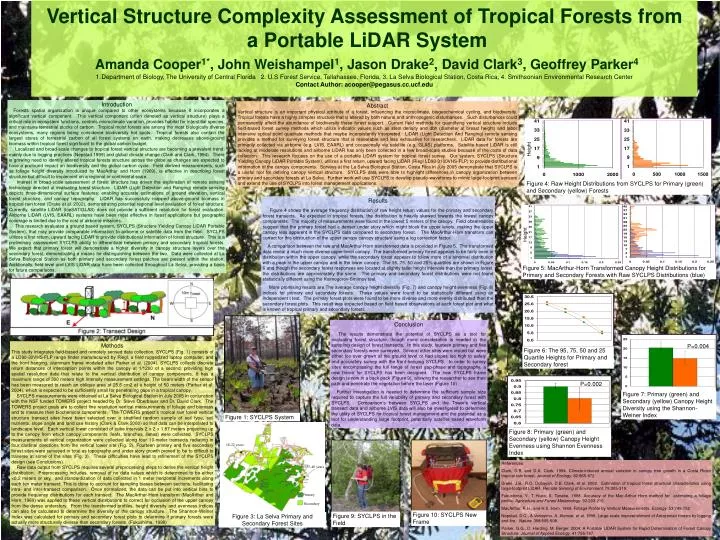
Vertical Structure Complexity Assessment of Tropical Forests from a Portable LiDAR System • Amanda Cooper1*, John Weishampel1, Jason Drake2, David Clark3, Geoffrey Parker4 • Department of Biology, The University of Central Florida 2. U.S Forest Service, Tallahassee, Florida, 3. La Selva Biological Station, Costa Rica, 4. Smithsonian Environmental Research Center • Contact Author: acooper@pegasus.cc.ucf.edu Height Figure 4: Raw Height Distributions from SYCLPS for Primary (green) and Secondary (yellow) Forests Height Figure 5: MacArthur-Horn Transformed Canopy Height Distributions for Primary and Secondary Forests with Raw SYCLPS Distributions (blue) P=0.002 Figure 1: SYCLPS System P=0.004 Figure 6: The 95, 75, 50 and 25 Quartile Heights for Primary and Secondary forest Figure 10: SYCLPS New Frame 18-22 years Figure 9: SYCLPS in the Field Figure 7: Primary (green) and Secondary (yellow) Canopy Height Diversity using the Shannon-Weiner Index 35-40 years Figure 8: Primary (green) and Secondary (yellow) Canopy Height Evenness using Shannon Evenness Index Primary Secondary Figure 3: La Selva Primary and Secondary Forest Sites Introduction Forests spatial organization is unique compared to other ecosystems because it incorporates a significant vertical component. This vertical component (often denoted as vertical structure) plays a critical role in ecosystem functions, controls microclimate variation, provides habitat for interstitial species, and maintains terrestrial stocks of carbon. Tropical moist forests are among the most biologically diverse ecosystems, many regions being considered biodiversity hot spots. Tropical forests also contain the largest stores of terrestrial carbon of all forest systems on earth, making decreases above-ground biomass within tropical forest significant to the global carbon budget. Localized and broad-scale changes to tropical forest vertical structure are becoming a prevalent trend, mainly due to logging practices (Nepstad 1999) and global climate change (Clark and Clark, 1994). There is growing need to identify altered tropical forests structure across the globe as changes are expected to have a profound impact on biodiversity and the global carbon cycle. Field derived measurements, such as foliage height diversityintroduced by MacArthur and Horn (1969), is effective in describing forest structure but difficult to implement on a regional or continental scale. Interest in broad-scale assessment of forest structure has driven the exploration of remote sensing technology directed at evaluating forest structure. LiDAR (Light Detection and Ranging) remote sensing depicts three-dimensional surface features; enabling accurate estimations of ground elevation, vertical forest structure, and canopy topography. LiDAR has successfully mapped above-ground biomass in tropical rain forest (Drake et al. 2002), demonstrating potential regional level evaluation of forest structure. Currently, satellite LiDAR (IceSAT/GLAS) does not provide a sufficient resolution for forest evaluation. Airborne LiDAR (LVIS, EAARL) systems have been most effective in forest applications but geographic coverage is limited due to the cost of airborne missions. This research evaluates a ground based system, SYCLPS (Structure Yielding Canopy LiDAR Portable System), that may provide comparable information to airborne or satellite data from the field. SYCLPS utilizes a first return, upward facing LiDAR to provide distributional information of forest structure. This is a preliminary assessment SYCLPS ability to differentiate between primary and secondary tropical forests. We expect that primary forest will demonstrate a higher diversity in canopy structure layers over the secondary forest, demonstrating a means for distinguishing between the two. Data were collected at La Selva Biological Station as both primary and secondary forest patches are present within the station. Additionally, field level and LVIS LiDAR data have been collected throughout La Selva, providing a basis for future comparisons. Abstract Vertical structure is an important physical attribute of a forest, influencing the microclimate, biogeochemical cycling, and biodiversity. Tropical forests have a highly complex structure that is altered by both natural and anthropogenic disturbances. Such disturbances could permanently affect the abundance of biodiversity these forest support. Current field methods for quantifying vertical structure include field-based forest survey methods which utilize indicator values such as stem density and dbh (diameter at breast height) and labor intensive optical point quadrate methods that maybe inconsistently interpreted. LiDAR (Light Detection And Ranging) remote sensing provides a method for surveying forest structure that is repeatable and less exhaustive for researchers. LiDAR data for forests are primarily collected via airborne (e.g. LVIS, EAARL) and occasionally via satellite (e.g. GLAS) platforms. Satellite-based LiDAR is still lacking at moderate resolutions and airborne LiDAR has only been collected in a few broad-scale studies because of the costs of data collection. This research focuses on the use of a portable LiDAR system for tropical forest survey. Our system, SYCLPS (Structure Yielding Canopy LiDAR Portable System), utilizes a first return, upward facing LiDAR (Riegl LD90-3100VHS-FLP) to provide distributional information of the canopy components. Surveys at the La Selva Biological Station, Costa Rica in July 2005 demonstrate that SYCLPS is a useful tool for defining canopy vertical structure. SYCLPS data were able to highlight differences in canopy organization between primary and secondary forests at La Selva. Further work will use SYCLPS to develop pseudo-waveforms to mimic large-footprint sensors and extend the use of SYCLPS into forest management applications. Results Figure 4 shows the average frequency distribution of raw height return values for the primary and secondary forest transects. As expected in tropical forests, the distribution is heavily skewed towards the lowest canopy components. The majority of measurements were found in the lowest 5 meters of the canopy. Field observations suggest that the primary forest had a denser under story which might block the upper levels, making the upper canopy less apparent in the SYCLPS data compared to secondary forest. The MacArthur-Horn transform can correct for this obstruction of the upper canopy canopy structure using a log correction factor. A comparison between the raw and MacArthur-Horn transformed data is provided in Figure 5. The transformed data reveal a much more diverse upper-level canopy. The transformed primary forest appears to be fairly even in distribution within the upper canopy, while the secondary forest appears to follow more of a binomial distribution with a peak in the upper canopy and in the lower canopy. The 95, 75, 50 and 25% quartiles are shown in Figure 6 and though the secondary forest responses are located at slightly taller height intervals than the primary forest, the distributions are approximately the same. The primary and secondary forest distributions were not found statistically different using the Kolmogorov-Smirnov test. More promising results are The average canopy height diversity (Fig. 7) and canopy height evenness (Fig. 8) indices for primary and secondary forests. These values were found to be statistically different using an independent t test. The primary forest plots were found to be more diverse and more evenly distributed than the secondary forest plots. This result was expected based on field based observations at each forest plot and what is known of tropical primary and secondary forests. Conclusion The results demonstrate the potential of SYCLPS as a tool for evaluating forest structure, though more consideration is needed in the sampling design of forest transects. In this study, fourteen primary and five secondary forests were surveyed. Several other sites were visited but were either too over grown at the ground level or had slopes too high to safely and accurately survey with the front-hanging SYCLPS. In order to survey sites encompassing the full range of forest gap-phase and topography, a new frame for SYCLPS has been designed. The new SYCLPS frame design is now in a back pack (Figure 9), allowing the researcher to see their path and penetrate the vegetation before the laser (Figure 10) Further investigation is needed to determine the sufficient sample size required to capture the full variability of primary and secondary forest with SYCLPS. Comparison’s between SYCLPS and the Tower’s vertical transect data and airborne LVIS data will also be investigated to determine the utility of SYCLPS for tropical forest management and the potential as a tool for understanding large footprint, potentially satellite based waveform data. Methods This study integrates field-based and remotely sensed data collection. SYCLPS (Fig. 1) consists of a LD90-30VHS-FLP range finder manufactured by Riegl, a field ruggedized laptop computer, and the front hanging, aluminum frame modeled after Parker et al. (2004). SYCLPS collects discrete return distances of interception points within the canopy at 1/1200 of a second, providing high spatial resolution data that relate to the vertical distribution of canopy components. It has a maximum range of 300 meters high intensity measurement settings. The beam width of the sensor has been measured to reach an oblique area of 25.6 cm2 at a height of 50 meters (Parker et al. 2004), which is expected to be sufficiently small for penetrating gaps in a tropical canopy. SYCLPS measurements were obtained at La Selva Biological Station in July 2005 in conjunction with the NSF funded TOWERS project headed by Dr. Steve Oberbauer and Dr. David Clark. The TOWERS project goals are to collect fine resolution vertical measurements of foliage and biomass and to measure their biochemical components. The TOWERS project’s tropical rain forest vertical structure transect sites have been selected over a stratified random sample of soil type, soil nutrients, slope angle and land use history (Clark & Clark 2000) so that data can be interpolated to landscape level. Each vertical tower consisted of cube intervals 2 x 2 x 1.87 meters projecting up to the canopy from which canopy components (leafs, branches, lianas) were collected. SYCLPS measurements of vertical organization were collected along four 10-meter transects radiating in four cardinal directions from the vertical tower site (Fig. 2). Fourteen primary and five secondary forest sites were surveyed in total as topography and under story growth proved to be to difficult to traverse at some of the sites (Fig. 3). These difficulties have lead to refinement of the SYCLPS design (see Conclusions). Raw data output from SYCLPS requires several preprocessing steps to derive the vertical height distribution. Preprocessing includes, removal of no data values which is determined to be either <0.2 meters or sky, and standardization of data collected in 1 meter horizontal increments along each ten meter transect. This is done to account for sampling biases between sections, facilitating intra- and inter-transect comparison. Once normalized, the data can be put into vertical bins to provide frequency distributions for each transect. The MacArthur-Horn transform (MacArthur and Horn, 1969)was applied to these vertical distributions to correct for occlusion of the upper canopy from the dense understory. From the transformed profiles, height diversity and evenness indices can also be calculated to determine the diversity of the canopy structure. The Shannon-Weiner Index was calculated for primary and secondary forest plots to determine if primary forests were actually more structurally diverse than secondary forests. (Fukushima, 1998) References Clark, D.B. and D.A. Clark. 1994. Climate-induced annual variation in canopy tree growth in a Costa Rican tropical rain forest. Journal of Ecology. 82:865-872 Drake, J.B., R.O. Dubayah, D.B. Clark, et al. 2002. Estimation of tropical forest structural characteristics using large-footprint LiDAR. Remote Sensing of Environment. 79:305-319. Fukushima, Y., T Hiura, S. Tanabe. 1998. Accuracy of the Mac-Arthur Horn method for estimating a foliage profile. Agriculture and Forest Meteorology. 92:203-210. MacArthur, R.H., and H.S. Horn. 1969. Foliage Profile by Vertical Measurements. Ecology. 53:749-752 Nepstad, D.C., A.Verissimo, A. Alencar, et al. 1999. Large-scale impoverishment of Amazonian forests by logging and fire. Nature. 398:505-508. Parker, G.G., D. Harding, M. Berger. 2004. A Portable LIDAR System for Rapid Determination of Forest Canopy Structure. Journal of Applied Ecology. 41:755-767.