Download
1 / 41
410 likes | 509 Views
Sensitivity of satellite observations for freshly produced lightning NO x. Steffen Beirle, MPI Mainz M. Salzmann, M. G. Lawrence, U. Platt, and T. Wagner. Lightning NO x. ... is important : Dominating source in tropical UT Released in the UT: long lifetime, low background levels

E N D
Sensitivity of satellite observations for freshly produced lightning NOx Steffen Beirle, MPI Mainz M. Salzmann, M. G. Lawrence, U. Platt, and T. Wagner
Lightning NOx... ... is important: • Dominating source in tropical UT • Released in the UT: long lifetime, low background levels → strong impact on tropospheric O3 and OH ... is uncertain: • „Magic number“ 5 Tg [N]/yr • uncertainty still 1order of magnitude • besides total number: • regional variations • Intracloud flashes versus Cloud to ground • ...
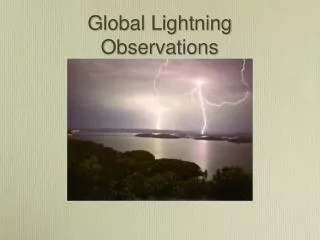
Satellite observations... ... provide new independent measurements ... have high potential: • time series • global cover → analysis of temporal & spatial patterns on different scales and for different conditions → use them to constrain LNOx estimates!
Different approaches: 1. mean NO2 enhancement due to lightning activity
Different approaches: 1. mean NO2 enhancement due to lightning activity Disadvantages: Observed NO2 (~10 a.m.) is aged LNO2 • Dillution • Transport • Lifetime
Different approaches: 2. direct obs 1. mean NO2 enhancement due to lightning activity 2. direct observation of freshly produced LNOx
1.7 (0.6-4.7) Tg [N]/year Beirle et al., ACP 6, 2006 Different approaches: 2. direct obs
Direct observation of fresh LNOx Satellite observations over active thunderstorm + confined region of interest + negligible chemical loss / dilution (within satellite pixel, 30 min.) -highly complex observation conditions (cumulonimbus clouds) → what do we actually "see"?
Satellite sensitivity for (L)NOx • Measured: Slant column density S • Wanted: Vertical column density V • S = V * A A: Air Mass Factor • S = V * S ai * pi ai: box-AMF pi: profile (norm.) • SNO2 = VNOx * S ai * li * pi li := [NO2] / [NOx] • SNO2 = VNOx * S ei * pi = VNOx * E Visibility ei = ai * li "box-AMF for NOx" Sensitivity E = S ai *li * pi = S ei * pi = SNO2 / VNOx
Satellite sensitivity for (L)NOx SNO2 = VNOx * S ei * pi = VNOx * E Visibility ei = ai * li Sensitivity E = S ei * pi E = S ai * li * pi Idea: Use cloud resolving model results for a thunderstorm simulation to investigate temporal and spatial variability/evolution of ei and E!
Cloud resolving model Radiative transfer model MCArtim Hydrometeors Satellite sensitivity for (L)NOx SNO2 = VNOx * S ei * pi = VNOx * E Visibility ei = ai * li Sensitivity E = S ei * pi E = S ai * li * pi
CSRMC (Marc Salzmann)(Cloud system resolving model including photochemistry) • 3d cloud resolving model ((photo)chemistry+dynamics) • One week of thunderstorms in the TOGA COARE/CEPEX region (Pacific) • Output grid: dt=30 min, dx=dy=2km, dz=500m • Output: NOx, NO2, O3, T, J ... • Extinction simply parameterized from cloud water&ice (literature) • Snow, graupel and rain neglected (few large particles) McArtim: Box-AMFs for all locations at all timesteps
NOx volume mixing ratios and qtotm = 0.01g/kg contour during the development of a mesoscale convective system from 24 December 1992, 10:00 UTC to 24 December 1992, 12:30 UTC from the LTN1 run. Salzmann et al., ACP, 2008
Sensitivity E = S ai * li * pi = S ei * pi = SNO2 / VNOx E= Two examples COT= Modelled sensitivities LNOx Profile NOx partitioning Box-AMF Visibility ~pi li ai ei
Sensitivity E = S ai * li * pi = S ei * pi = SNO2 / VNOx Ensemble Means E= COT= Modelled sensitivities LNOx Profile NOx partitioning Box-AMF Visibility ~pi li ai ei
Sensitivity E = S ai * li * pi = S ei * pi = SNO2 / VNOx ... show small variability ... show small dependence on COT Modelled sensitivities
Spatial patterns • Spatial mean sensitity (relevant for applications): E=0.46 (0.37-0.55)
For more details... ... see Beirle et al., Sensitivity of satellite observations for freshly produced lightning NOx, ACPD (“in print”), 2008. In addition: • Error discussion • Impact of RTM settings (negligible!) • Impact of satellite resolution (does not change results) • Impact of background NOx: critical! (shielding!)
Visibility & sensitivity for LNOx: results • Satellites "look" deep inside the cloud • But at the cloud top, there is nothing to see • Cloud top: ei~0 (due to low li) • Ground: ei~0 (due to low ai) • Cloud middle: ei maximum (1-2) • We find low variability of E over one week of thunderstorm simulations! • On average, E is lowest over anvils • Mean E=0.46 (0.37-0.55) • Sat. meas. are sensitive for LNOx!
E=0.46 (this study) 0.9 Tg [N]/year Gulf of Mexico revisited E0.25 (inconsistent literature sources for pi, li, ai) 1.7 (0.6-4.7) Tg [N]/year Beirle et al., ACP 6, 2006
Outlook • One model study: How representative? • Repeat study for other thunderstorms (using other models) • One empirical study: find more! • Systematic search for coincidences of flashes (WWLLN) during SCIAMACHY / GOME-2 overpass: High variability! • Possible reasons: • regional differences of LNOx production efficiency (Huntrieser et al., 2008) • general high variability of LNOx production/flash? • need of higher moments / pdfs instead of means? • Satellite observations have the potential to improve our knowledge on LNOx!
Sensitivity results • Single sensitivities vary (~0.1-1) • Mean sensitivity (~0.3-0.7) always higher than in Mexico-Study (0.25) ! → is the modelled storm representative? • With these sensitivities, every active thunderstorm (>500 flashes per SCIAMACHY pixel 30x60km2)should be clearly visible from space (SNO2>2.5e15 molec/cm2) → what do we see?
Observations of fresh LNOx • GOME-event in Gulf of Mexico: • perfect spatial/temporal matching • lightning information (NLDN) • Meanwhile: • 4 years of SCIAMACHY data • 3 years of WWLLN data (global continuous ground based lightning counts) • Automated search for „lightning events“ prior SCIAMACHY overpass: 1680 matches!!! • keep in mind: 10:00 local time! → Coincidences almost all over oceans
Some examples... Flash time NO2 Clouds Australia 1015 Red: <30 min Blue: 90-120 min Grey: 2-24 h Tropospheric Slant Column SNO2 FRESCO CF&CTH Black: cloud free Coloured: cloudy Red: high cloud Blue: low cloud
Some examples... Flash time NO2 Clouds Pacific 1015 In the middle of nowhere...
Some examples... Flash time NO2 Clouds USA 1015 Maximum > 2e16!
What happens here??? Flash time NO2 Clouds Korea 1015
What happens here??? Flash time NO2 Clouds China Hong Kong 1015
What happens here??? Flash time NO2 Clouds Australia 1015
What is different??? Flash time NO2 Clouds Australia 1015
Global pattern SNO2 • Regional differences: • Higher values over land • Higher values close to strong ground sources, indicating deep convection • Higher values east from Australia???
Statistics: SNO2 for coinciding lightning events SNO2 Every dot: SCIA-Pixel with more than 5 WWLLN flashes and cf>0.5 log10(flashes)
Statistics: S NO2 for coinciding lightning events SNO2 Every dot: SCIA-Pixel with more than 5 WWLLN flashes and cf>0.5 More than 0 10 100 1000 Flashes within the last hour CTH
Some open questions • Where is the LNOx? • observed SNO2 enhancement for SCIA-pixels with >1000 flashes (corrected for WWLLN sensitivity):1.6*1015 molec/cm2 on average • expected: 5*1016 molec/cm2 !!! • How to hide LNOx completely? • in no simulation run E<0.1 • What makes the difference between good and no signal? 30* higher !!!
LNOx profile: Cloud resolving models Pickering et al. 1998 Fehr et al. 2004 NOx partitioning: In-situ measurements in New Mexico for cb conditions Ridley et al. 1994, 1996 Box AMFs: (sensitivity) RTM, cb conditions Hild et al. 2002 [NO2]/[NOx] Box AMF fraction of total SNO2 = VNOx * S ai * li * pi E = 0.25 (0.14-0.5) ai pi li Problem: different, possibly inconsistent sources → use one source: cloud resolving model
Sensitivity E = S ai * li * pi = S ei * pi = SNO2 / VNOx Modelled sensitivities LNOx Profile NOx partitioning Box-AMF Visibility ~pi li ai ei Ensemble Means E= COT= Lowest sens.