Download
1 / 40
410 likes | 527 Views
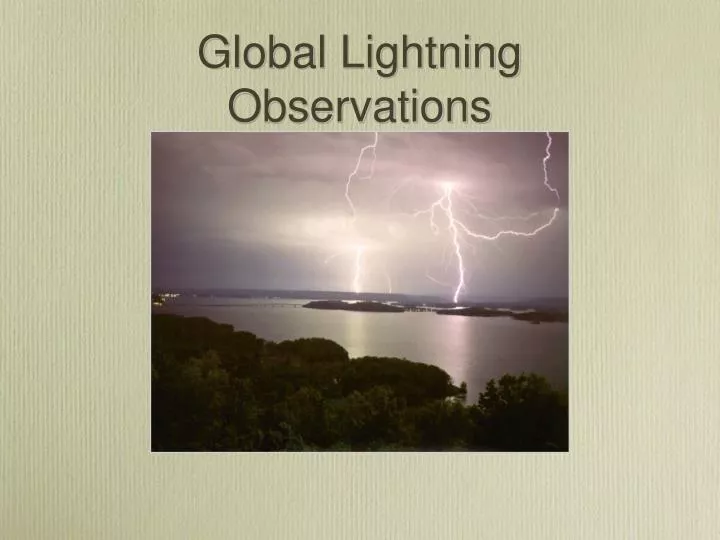
Global Lightning Observations. Streamers, sprites, leaders, lightning : from micro- to macroscales. Remote detection of lightning - information provided LIS and OTD - what they are and how they work Results from global observations Next generation Change ?. + + + + + + + +. + + + +

E N D
Streamers, sprites, leaders, lightning: from micro- to macroscales • Remote detection of lightning - information provided • LIS and OTD - what they are and how they work • Results from global observations • Next generation • Change ?
+ + + + + + + + + + + + + + + + - - - - - - A schematic of grauple - ice crystal charge transfer in a thunderstorm Lightning production is related to microphysical and dynamic cloud processes. Ice interactions seem to play the major role in thunderstorm electrification. Particularly rebounding collisions of graupel and ice crystals – Non-inductive charging mechanism. Necessary conditions for thunderstorm electrification: a) strong enough up-draft to grow precipitation size ice. b) ice-graupel collisions in the presence of water
Lightning Connection to Thunderstorm Updraft, Storm Growth and Decay • Total Lightning —responds to updraft velocity and concentration, phase, type of hydrometeors — integrated flux of particles • WX Radar — responds to concentration, size, phase, and type of hydrometeors- integrated over small volumes • Microwave Radiometer — responds to concentration, size, phase, and type of hydrometeors — integrated over depth of storm (85 GHz ice scattering) • VIS / IR — cloud top height/temperature, texture, optical depth
Why observe lightning?(Forecasting) Tornado time Lightning Radar Time
Temperature Positive charge Positive charge Charging zone Negative charge Negative charge Positive charge F Positive charge Flux Hypothesis Hypothesis:Lightning frequency (F) proportional to product of upward non precipitation ice mass flux (I) and precipitation ice mass flux (p) F = c*p*I Supported by simple calculations (Blyth et al. 2001) and lightning model results (Baker et al. 1995, 1999). p
STEPS Results – 6 June 2000 ‘Garden Variety’ Single Cell Storm Lightning per radar volume time Non- Precipitation ice mass flux[g s-1m-2] * 1011 Precipitation ice mass flux [g s-1 m-2] * 1012
How good is the apparent correlation between lightning and IWP and how does it vary between regimes? Method • Create land, ocean, coastal data mask • Create scatter plot of data in previous figure (0.5 x 0.5o grid) for each partition Result • Noisy, but clear correlations above sample noise floor in flash density • Eyeball says best fit lines would be very similar
Clarify Signal: Ocean, Coast and Land IWP Binned by Flash Density (All rain certain pixels with detectable IWP included) TRMM PR IMP • When averaged, correlation is very strong, best fit lines independent of regime. • ~95% (75%) of oceanic (coast) flash density distribution in sampling noise (low flash density; <.007 fl/km2/day = 0.2 fl/km2/mo), low IWP (~.01-.02 kg/m2). Sampling + DE threshold + occurrence! • Similar functional relationships between rain (Iiquid) – lightning vary by regime.
Sample “Virtual radar” retrieval Truth (radar) Retrieval GPROF (cloud model) (µwave + lightning)
Instrument designChristian et al, J. Geophys. Res., 1989 • Fast lens, narrowband filter at 777.4 nm • 128 x 128 CCD array, 500 fps imaging • Frame-to-frame subtraction isolates lightning transients against bright daytime background
8 km 8 km 8 km nominal spatial resolution optimizes the lightning-to-background S/N ratio. Measurement: Spatial Discrimination
Measurement:Temporal Discrimination CCD integration interval is set to 2 ms to minimize pulse splitting between frames and minimize integration of background signal
Measurement: Spectral Filtering Narrow band interference filter passes only light from 1nm wide oxygen mutiplet
Lightning Detection from Low Earth Orbit Optical Transient Detector ( launched April, 1995 ) Lightning Imaging Sensor ( launched November, 1997 )
History: LIS (1997-present) • Lower orbit, smaller Field of View, tropical inclination
High Resolution Full Climatology Annual Flash Rate Global distribution of lightning from a combined nine years of observations of the NASA OTD (4/95-3/00) and LIS (1/98-12/04) instruments
Climatology: Diurnal cycle ( Local hour )
Climatology: Diurnal cycle ( UTC Hour )
Global lightning is modulated on annual & diurnal time scales, as well as seasonally and interannually
Winter 1998-99 (La Niña) Lightning Responsive to Interannual Variability Winter 1997-98 (El Niño)
Major Points for Severe Weather • Primary lightning signature is high flash rates and the “jump” • Lightning flash rate is correlated storm intensity - higher rate implies stronger storm. • Evolution of the lightning activity follows the updraft. Increasing activity means the storm intensifying; decreasing activity means the updraft is weakening. • A jump in lightning activity is associated with a pulse in updraft intensity • These signatures, in conjunction with other NWS assets can be used to: • Separate intensifying from weakening storms • Identify storms in process of going severe • Quickly determine the most intense storms in a complex system • Improved warning times • Reduced false alarms rates
Lightning Sensing from GEO • Climate Monitoring • Storm Development • Ice-phase precipitation estimates • Severe Weather Now-casting • Data assimilation and model inputs • Atmospheric chemistry
GLM : Field of View at GOES West and East • GOES W (75ºW) GOES E (135ºW) • OTD climatology indicates lightning density • Range rings indicate limits of 10, 15, 20, & 50 km pixel footprint