Download
1 / 19
190 likes | 194 Views
This study discusses the interpretation of satellite observations of tropospheric NO2 and their implications for TROPOMI, with a focus on top-down constraints on NOx emissions and estimates of surface air quality. It also highlights the challenges faced by models in accurately representing NO2 vertical profiles and NOx emissions.

E N D
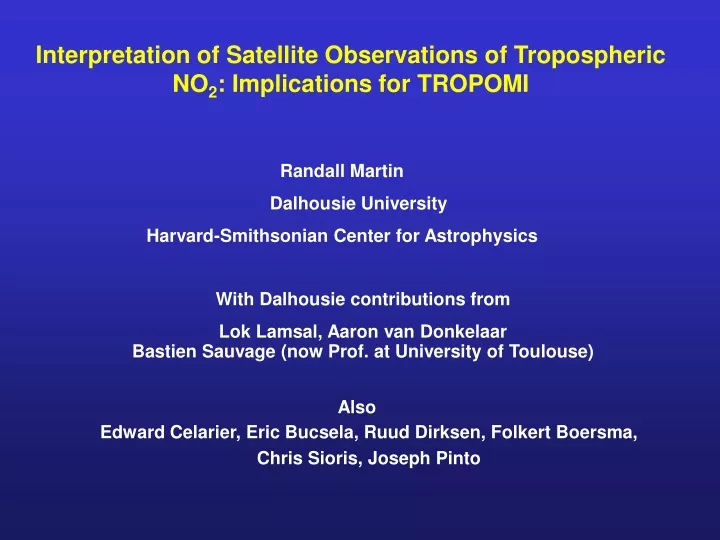
Interpretation of Satellite Observations of Tropospheric NO2: Implications for TROPOMI Randall Martin Dalhousie University Harvard-Smithsonian Center for Astrophysics With Dalhousie contributions from Lok Lamsal, Aaron van Donkelaar Bastien Sauvage (now Prof. at University of Toulouse) Also Edward Celarier, Eric Bucsela, Ruud Dirksen, Folkert Boersma, Chris Sioris, Joseph Pinto
Two Major Applications of Tropospheric NO2 Columns Top-down Constraints on NOx Emissions Estimates of Surface Air Quality Based on PM2.5, O3, and NO2
Insufficient In Situ NO2 Measurements for Air QualityNO2 Associated with Mortality (Brook et al. 2007) In Situ Monitors Contaminated with Reactive Nitrogen Highest NO2 maximum quarterly mean by county, 2001
OMI Tropospheric NO2 Column Proxy for Surface Concentration Simulated Annual Mean Concentrations (GEOS-Chem) over North America OMI: Oct 2004 – Sept 2007 r2=0.96 n=652
Tropospheric NO2 Column Strongly Related to Ground-level Concentration over Land In Situ GEOS-Chem Texas AQS Martin et al., 2004 Eastern North America New England In Situ GEOS-Chem ICARTT Martin et al., 2006
In Situ GEOS-Chem General Approach to Estimate Surface NO2 from OMI Modeled NO2 Profile OMI Tropospheric NO2 Column • S→ Surface NO2 • Ω → Tropospheric NO2 column
Specific Approach to Estimate Surface NO2Use OMI to Infer Sub-Grid Variation in NO2 Profile OMI (2o x 2.5o) OMI (0.1o x0.1o) Tropospheric NO2 Column (1015 molec cm-2) O S→ Surface NO2 Ω → Tropospheric NO2 column ΩF→Free tropospheric NO2 Specific approach changes result by 10-30%
Surface NO2 for 2005 Inferred from OMI MAM DJF SON JJA
Significant Correlation Between Corrected In Situ and OMI-derived Surface NO2 Standard Product Near-real-time Correlation of Coincident Observations over 2005
Comparison of In Situ and OMI-derived Surface NO2 for 2005Indirect Validation of OMI OMI (NRT) DJF MAM JJA SON In situ Spatial correlation = 0.78
Seasonal Comparison by Land TypeSummer Urban & Suburban Bias Suggests Higher Resolution Needed
Tropospheric HCHO/NO2Indicates Sensitivity of Surface Ozone to NOx and VOC EmissionsGEOS-CHEM Model Calculation For Polluted Regions, Mar-Nov NOx Saturated NOx Limited Martin et al., GRL, 2004
GOME Observations Show NOx-Limited Conditions over Polluted Regions in AugustMajor Industrial Areas are Clear Exceptions August Seasonal Evolution from NOx-Limited to NOx-Saturated Conditions Martin et al., 2004
Two Major Applications of Tropospheric NO2 Columns Top-down Constraints on NOx Emissions Estimates of Surface Air Quality Based on PM2.5, O3, and NO2
Top-Down Constraint on Surface NOx Emissions Inverse Modeling Tropospheric NO2 (1015 molec cm-2) NOx emissions (1011 atoms N cm-2 s-1) • Improved simulation versus in situ measurements of • reactive nitrogen in New England (Martin et al., 2006) • tropical tropospheric ozone (Sauvage et al., 2007) • Develop with more sophisticated computational tools
Satellite Observations Constrain Lightning Source Strength Meridional Average (O3) Meridional Average (NO2) GEOS-Chem with Lightning (6±2 Tg N yr-1) GEOS-Chem with Lightning (6±2 Tg N yr-1) SCIAMACHY OMI/MLS GEOS-Chem without Lightning GEOS-Chem without Lightning O3 Retrieval Error < 5 Dobson Units NO2 Retrieval Error ~ 5x10¹⁴ molec cm-2 Martin et al., JGR, 2007
Cloud Error Reduced with Increasing ResolutionIs Higher Spatial Resolution Possible? Fraction of global cloud-free observations 33% 4% 16% 1 km x 1 km 10 km x 10 km TROPOMI?? 40 km x 80 km GOME-2 Krijger et al., ACP, 2007
Implications for TROPOMI Prospects for surface air quality and NOx emissions Increase spatial resolution to: 1) resolve urban centers 2) reduce retrieval error from clouds Accuracy objective for NO2 of 1x10¹⁴ molec cm-2 for lightning Combine NO2 and HCHO: information on surface O3 Challenges for Models Accurate representation of - tropospheric NO2 vertical profile - NO2 columns / NOx emissions Supported by NASA and NSERC