Download
1 / 22
230 likes | 418 Views
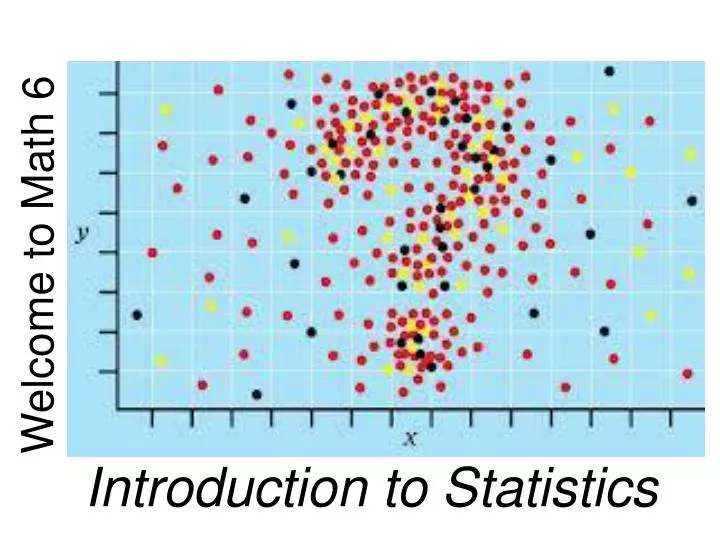
Welcome to Math 6. Introduction to Statistics. DEFINITION:. Statistics a- are numerical data relating to a group of individuals; b- statistics is also the name for the science of collecting, analyzing and interpreting such data. Key Vocabulary.

E N D
Welcome to Math 6 Introduction to Statistics
DEFINITION: • Statistics • a- are numerical data relating to a group of individuals; • b- statistics is also the name for the science of collecting, analyzing and interpreting such data.
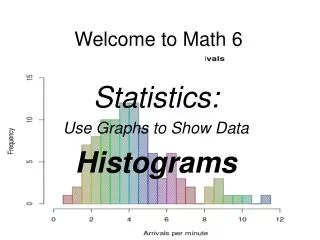
Key Vocabulary The terms you (the student) should learn to use with increasing precision are: statistics, data, variability, distribution, dot plot, histograms, box plots, median, and mean.
Key Vocabulary • Datameans the numbers produced in response to a statistical question. • Data is frequently collected from surveys or other sources (i.e. documents).
Key Vocabulary • Distributionis the arrangement of the values of a data set. Distribution can be described using center (median or mean), and spread.
Key Vocabulary Here are some graphs which show other examples of distribution of data.
Objective: Each student will: Recognize a statistical question as one that anticipates variability in the data related to the question and accounts for it in the answers.
Key Vocabulary Average- An average is a measure used to find the location of the middle (central tendency) of a set of data.
Key Vocabulary Spreadis another characteristic of a data set. It also known as the variability of the values. http://onlinestatbook.com/2/summarizing_distributions/variability.html
Statistical Questions:For example, “How old am I?” is not a statistical question, but “How old are the students in my school?” is a statistical question because one anticipates variability in students’ ages.
Identify Statistical Questions A statistical question is one that collects information that addresses differences in a population. The question is framed so that the responses will allow for the differences. For example, the question, “How tall am I?” is not a statistical question because there is only one response.
A statistical question: • collects information • addresses differences in a population. • is framed so that the responses will allow for the differences. “How tall are the students in my class?” is a statistical question since the responses anticipates variability.
Statistical questions can result in a narrow or wide range of numerical values. For example, asking classmates “How old are the students in my class in years?” will result in less variability than asking “How old are the students in my class in months?”
Statistical Questions • collects information • addresses differences in a population. • is framed so that the responses will allow for the differences. No Yes How old are the students in my school? X How old am I?
Statistical Questions • collects information • addresses differences in a population. • is framed so that the responses will allow for the differences. No Yes How many pets are owned by each student in my grade level? X How many pets do I own?
Statistical Questions • collects information • addresses differences in a population. • is framed so that the responses will allow for the differences. No Yes What are the math test scores of the students in my class? X What is my math test score?
Statistical Questions • collects information • addresses differences in a population. • is framed so that the responses will allow for the differences. No Yes How many cupcakes of each type were made at the bakery in a week? X What is my favorite type of cupcake?
Statistical Questions • collects information • addresses differences in a population. • is framed so that the responses will allow for the differences. No Yes How many letters are in the names of each person in my class? X How many letters are in my name?
Statistical Questions • collects information • addresses differences in a population. • is framed so that the responses will allow for the differences. No Yes What is the height of each person in my class? X What is my height?
Upcoming Vocabulary box plots, dot plots, histograms, frequency tables, cluster, peak, gap, mean, median, interquartile range, measures of center, measures of variability, data, MeanAbsolute Deviation (M.A.D.), quartiles, lower quartile (1st quartile or Q1), upper quartile (3rd quartile or Q3), symmetrical, skewed, summary statistics, outlier, spread
Assignments Search for at least 5 of the upcoming vocabulary terms on the internet. Write down a definition of the terms that makes sense to you.