Download
1 / 49
490 likes | 493 Views
BPP Technical Studies. Air Deposition Monitoring (SFEI). Representative Sample of Brake Pad Wear Debris (BMC/Link Test Labs). Air Deposition Modeling (AER). Physical & Chemical Characterization of Wear Debris (Clemson University). Copper Source Loading Estimates

E N D
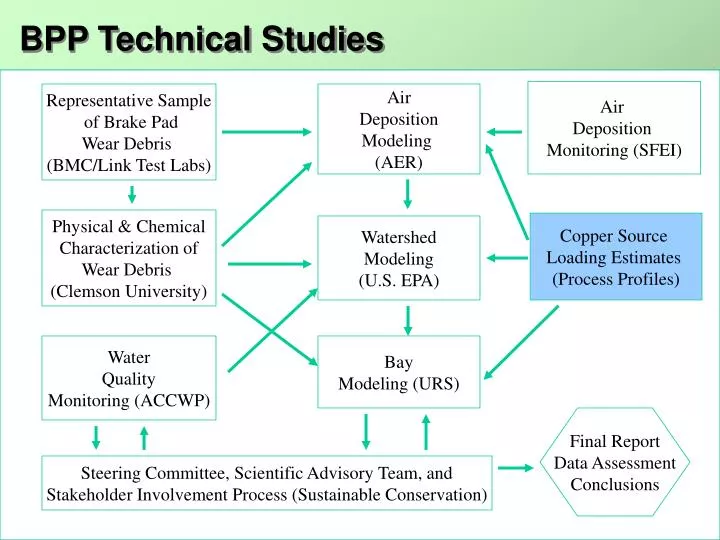
BPP Technical Studies Air Deposition Monitoring (SFEI) Representative Sample of Brake Pad Wear Debris (BMC/Link Test Labs) Air Deposition Modeling (AER) Physical & Chemical Characterization of Wear Debris (Clemson University) Copper Source Loading Estimates (Process Profiles) Watershed Modeling(U.S. EPA) Water Quality Monitoring (ACCWP) Bay Modeling (URS) Final Report Data Assessment Conclusions Steering Committee, Scientific Advisory Team, and Stakeholder Involvement Process (Sustainable Conservation) Process Profiles
Source Loading Estimates to Watershed Copper released from brake lining wear Copper released from non-brake sources Process Profiles
to air (EFair) to road (EFroad-ind) brake lining wear to vehicle to publicly-owned treatment works (EFPOTW) to road (EFroad-dir) Copper Released from Brake Lining Wear Process Profiles
Air Emission Factor Calculated three ways: • Composition/Wear Approach • Composition/Existing Emission Factor Approach • Tunnel Studies Process Profiles
Advantages of Using Tunnel Study Data • Releases measured from fleets in service • Representative of thousands of vehicles during actual (not simulated) use Process Profiles
to air (EFair) to road (EFroad-ind) brake lining wear to vehicle to publicly-owned treatment works (EFPOTW) to road (EFroad-dir) Partitioning Process Profiles
Emission Factors Process Profiles
Vehicle Miles Traveled Process Profiles
Results for the Brake Pad Releases of Copper in the San Francisco Bay Area Watershed Process Profiles
Vehicle Miles Traveled Process Profiles
Results for Brake Pad Releases of Copper in the Castro ValleyWatershed (amounts in kg copper/y) Process Profiles
Questions? Process Profiles
Air Emission Factor Comparison Process Profiles
Standard Uncertainty • Estimated for each value used in calculations • Standard deviation used if possible • More likely to be able to predict a potential range of possible values and estimate a standard uncertainty based on that Process Profiles
Benefits of Developing Standard Uncertainty • Allows for a standard uncertainty in results to be calculated Process Profiles
Benefits of Developing Standard Uncertainty (cont’) • Calculating confidence intervals: e.g. a 95% confidence interval the range of values that includes the result plus or minus two times the standard uncertainty Process Profiles
BPP Technical Studies Air Deposition Monitoring (SFEI) Representative Sample of Brake Pad Wear Debris (BMC/Link Test Labs) Air Deposition Modeling (AER) Physical & Chemical Characterization of Wear Debris (Clemson University) Copper Source Loading Estimates (Process Profiles) Watershed Modeling(U.S. EPA) Water Quality Monitoring (ACCWP) Bay Modeling (URS) Final Report Data Assessment Conclusions Steering Committee, Scientific Advisory Team, and Stakeholder Involvement Process (Sustainable Conservation) Process Profiles
Copper Released from Non-Brake Sources • Architectural copper • Copper in pesticides • Copper in fertilizer • Copper released from industrial facilities • Copper in domestic water discharged to storm drains Process Profiles
Concepts Commonto All Release Categories • Develop separate estimates for each environmental compartment (soil/air/surface water/storm water/bay waters) • Population and land use values were used to determine how releases within political boundaries are assigned to each watershed Process Profiles
1992 NLCD Land Use in the San Francisco Bay Area Watershed Process Profiles
Architectural Copper • Estimate surface area of copper roofs, copper gutters, and roofs with composite shingles containing copper biocide • Apply emission factors that are based on surface areas Process Profiles
Architectural CopperReleases in the Bay Area • Estimated total release from architectural copper is 1,500 kg/y • These releases are directly to storm drains; even in residential applications, these features are almost always hard-piped to storm drains Process Profiles
Pesticide • Pesticides applied to soil in urban areas • Agricultural applications to soil • Algaecide treatment of surface waters • Pool, spa, and fountain algaecides • Wood preservatives • Antifouling coatings Process Profiles
Pesticides Applied to Soil in Urban Areas • Used adjusted statewide values for sales and use • Total adjusted sales less adjusted agricultural use, antifouling coating use, algaecide use, use as root killer, and use in pressure-treated lumber is estimated statewide urban application to soil • Apportioned to the watersheds based on population Process Profiles
Pesticide Releases to Urban Soil in the Bay Area • Total estimated Bay area release of copper from copper-based pesticides to soil in urban areas is 100,000 kg in 2003 Process Profiles
Agricultural Applications to Soil • Based on adjusted reported use in the eight counties • Apportioned to the watersheds based on agricultural land use area Process Profiles
Agricultural Releases to Soil in the Bay Area • Total estimated Bay area releases of copper from copper-based pesticides to soil in agricultural areas is 12,000 kg in 2003 Process Profiles
Algaecide Treatment of Surface Waters • Reported adjusted uses to nonagricultural water areas in the eight counties assumed to occur at the shoreline of the bays • Reported adjusted uses in agricultural areas (apportioned by land use) and estimated uses in non-agricultural rights of way, recreation areas, and public health (apportioned by population) are assumed to be applied to surface waters Process Profiles
Algaecide Surface Water Releases in the Bay Area • Estimated copper in algaecide applications to shoreline waters are 1,900 kg/y • Adjusted copper in reported agricultural water area algaecide applications are 100 kg/y • Estimated copper in algaecide applications in non-agricultural rights-of-way, recreation areas, and public health are 1,200 kg/y Process Profiles
Pool, Spa, and Fountain Algaecides • Estimate the state-wide algaecide use of copper in copper-based algaecides by adding up reported uses to water along with a portion of sales for algaecide products whose uses are not reported • Pool, spa, and fountain use estimated as total algaecide use less adjusted reported use as algaecide • Assumed that 5% of copper used in pool, spa, and fountain algaecides is released to storm drains • Apportioned to the watersheds based on population Process Profiles
Pool, Spa, and Fountain Algaecide Releases in the Bay Area • Estimated releases of copper in pool, spa, and fountain algaecides to storm drains are 2,200 kg/y Process Profiles
Copper Released from Pressure-Treated Lumber • Based on nationwide use of copper in pressure-treated lumber (13 million kg/y) • An estimated 5.5 million kg/y of copper in pressure-treated lumber leaches out • Assume that 25% of copper leached from pressure-treated lumber is not susceptible to runoff • Releases are to soil • Apportioned to the watersheds based on population Process Profiles
Copper Released from Pressure-Treated Lumber in the Bay Area • Estimated releases of copper from pressure-treated lumber are 72,000 kg/y Process Profiles
Copper inAnti-Fouling Coatings • Estimate surface area of boats berthed in the bay • Apply emission factors that are based on surface area • Releases are directly to bay waters Process Profiles
Copper Released from Anti-Fouling Coatings to Bay Waters • Estimated releases of copper from anti-fouling coatings are 9,000 kg/y Process Profiles
Fertilizers • Based on reported statewide farm and non-farm fertilizer use by fertilizer category coupled with copper concentrations in various fertilizer categories • Assumed that 25% of farm use was tilled into soil and not available for runoff • Releases are to soil • Farm use apportioned to the watersheds based on land use area; non-farm use based on population Process Profiles
Copper Released from Fertilizers in the Bay Area • Estimated releases of copper from fertilizer use are 9,000 kg/y Process Profiles
Industrial Facilities • Industrial air emissions • Industrial runoff Process Profiles
Copper Released in Industrial Air Emissions in the Bay Area • Based on TRI data • Releases are to air • Eleven facilities reported air releases of 359 kg copper in 2003 Process Profiles
Copper Released in Industrial Runoff in the Bay Area • Estimate industrial land use area in each watershed • Apply an emission factor that is based on industrial land use area • Releases are direct to storm drains • Estimated releases of copper in industrial runoff are 1,300 kg/y Process Profiles
Domestic Water Discharged to Storm Drains • Based on a per-person emission factor that is in turn based on copper concentrations in domestic tap water and the volume of domestic water that is released to storm drains Process Profiles
Copper Released in Domestic Water Discharged to Storm Drains in the Bay Area • Estimated releases of copper in domestic water discharged to storm drains are 510 kg/y Process Profiles
Overview of Results: Copper Released from Non-Brake Sources in the Bay Area • Estimated releases of copper to soil are 200,000 kg/y • Estimated releases of copper to air are 359 kg/y • Estimated releases of copper to Bay waters are 11,000 kg/y • Estimated releases of copper to surface waters and storm drains are 6,900 kg/y Process Profiles
Sources Not Included in this Inventory • Fossil fuel combustion • Wood burning • Vehicle fluid leaks • Exposed conducting wire used to power public transit systems • Runoff from landfills Process Profiles
Questions? Process Profiles
Architectural CopperEmission Factors Process Profiles
Estimating Pesticide Releases to Urban Soil Process Profiles
Adjusted Reported Agricultural Uses in the Bay Area Counties Process Profiles
Surface Water Algaecide Use in the Bay Area Counties(values in kg copper) Process Profiles