Download
1 / 48

E N D
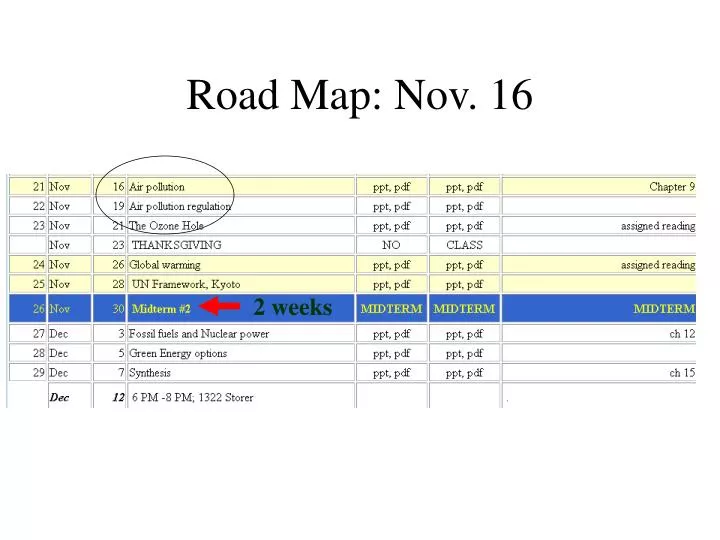
Road Map: Nov. 16 2 weeks
Central London during the killer smog, December 1952. At this point, visibility is less than 30 feet. During the height of the smog, people could not see their own hands or feet, and buses had to be led by policemen walking with flares.Credit: 'When Smoke Ran Like Water', by Devra Davis, Perseus Books "Night at Noon." London's Piccadilly Circus at midday, during a deadly smog episode, this time in the winter of 1955.Credit: 'When Smoke Ran Like Water', by Devra Davis, Perseus Books Research by Rutgers University's Paul Lioy and others shows that as the amount of smoke and pollutants in the air shot up during the week of Dec. 5, 1952, so did the death rate in greater London. Estimates say the smog killed anywhere from 4,000 to 11,000 people. Credit: Paul Lioy, Rutgers University
What chemicals contribute to air pollution? In what ways are both excess and insufficient ozone bad? How does geography and sunlight make pollution problems worse? How is the air in CA? What are the problem areas? What is happening to the ozone hole? Getting larger, smaller? How do cars pollute the atmosphere? How have cars improved over the past 20? years? If cars have improved, then why is the air not cleaner? What are the human health consequences of air pollution? Is there a common signature of (air) pollution with economic development? How did the US manage to get a handle on air pollution? Air Pollution lecture highlights
Our problem • We are intimately connected to air: • About the area of a tennis court • Lung is ~100 m2 and ~0.01 m3 • 8 liters air/ minute • 11,500 liters/day
SO2 Coal burning power, Industrial production Northeast NOX Automobiles Others CO – carbon monoxide Lead Mercury PM10 Agriculture Automobiles VOC (Volatile organic compounds, eg, benzene) Industry A brief list of culprits in air pollution
SMOG: a legacy of the Industrial Revolution • “smog” 1st used in 1905 at a health conference • December 1930, Meuse Valley, Belgium • 63 people died • Oct 26-31, 1944 Donora PA • 20 dead, 7000 (50% of town) ill • Dec 4-10, 1952: 3000 Londoners died from smog • Three other events between 1948 and 1956 • “Coketown lay shrouded in a haze of its own, which appeared impervious to the suns rays. You only knew the town was there because there could be no such sulky blotch upon the prospect without a town” C. Dickens, Hard Times
Air getting better despite lots of factors that increase the difficulty to improve
Atmospheric Problems • The bottom line • Air quality, on many fronts, is getting better. • Air quality is not improving everywhere, or with respect to all pollutants. Lots left to be done. • Air pollution: SOx, NOx, O3, VOC, Particulates. • Gray smog / Brown smog • Ozone layer: O3; Protects us from UVB radiation, • Thinnest and most susceptible over poles. • Chlorofluorocarbons; Cl (chlorine reacts in sunlight with O3) • Another problem that is getting better. • Global warming: • earth is warming; • CO2 traps heat; CO2 is increasing. • The two are very likely to be connected. • The consequences are likely to be large for some people. • Not improving
SMOG comes in different flavors • Brown smog (NOx) • Photo-activated chemical reactions • Gray smog (SO2) • Industrial smog • “Natural” smogs • Dust storms • Smoke from fire • Most cities exhibit combinations of each
The big difference between gray and brown smog: SOURCE London Gray Smog LA Brown Smog Coal burning power plants
Gray vs Brown Smog Sulfur dioxide Nitrogen Oxides
Why is smog not a simple function of industrial output? Production of smog forming chemicals is approximately constant. Air mixing attributes changes the impact of the smog. Some cities are plagued by poorer air mixing than others.
Hence, Fairbanks, but not Anchorage, Duluth but not Dubuque, Tucson but not Tallahassee
Automobile Emission Control System Point source pollution: control the tailpipe…. How do we do this? Cars, boat motors, motorcycles, trucks, lawnmowers, leafblowers…
Particulates can cause irritation at many points • Constriction of the bronchi • Filling of alveoli with mucus • Permanent damage to alveoli
Remember • We are intimately connected to air: • About the area of a single tennis court • Lung is ~100 m2 and ~0.01 m3 • 8 liters air/ minute • 11,500 liters/day • A 10 x 10 x 10 ft room
Health costs • 150 million Americans are exposed to unhealthy air • It is estimated that air pollution costs $50 billion/year in medical expenses • Kilburn 1984 • Children raised in the South Coast Air Basin suffer a 10% to 15% decrease in lung function compared to children who grow up where the air is less polluted.. • Hall. 1989. • Meeting federal clean air standards for ozone and fine particulates in the South Coast region would provide $9.4 billion in health-related benefits each year. • 98% of the four-county basin's population of 13 million is exposed to unhealthful air, with children especially vulnerable.
Ecosystem damage caused by sulfur dioxide emissions and acid rain. Sudbury, Ont
Acid Precipitation, 2005 Why does the east have such a problem with acid rain?
Air Pollution Control • Early approach: “Dilution is the solution to pollution” • Particulate removal - air filters • Sulfur removal - scrubbers • Nitrogen oxide reduction - catalytic converters • Hydrocarbon controls - afterburners
Effects of Acid Rain • Decreased soil and water pH • Increased fish mortality • Partially due to aluminum toxicity brought on by acidity • Increased tree mortality • Decreased leaf longevity • Increased disease damage • Increased soil nutrient leaching
Ozone and acid rain on forest health: Sierra forests under stress OZONE Sierra Nevada
OZONE damage • Damages photosynthetic apparatus in plants and results in increased tree mortality • Measurable increased tree mortality in California is linked to sites with high ozone transport values Good Ozone / Bad Ozone O3
Where we are in California? CA is divided into air basins by the Air Resources Board (ARB)
Various standards Still an amazing number of days where CA is out of compliance