Download
1 / 36
370 likes | 662 Views
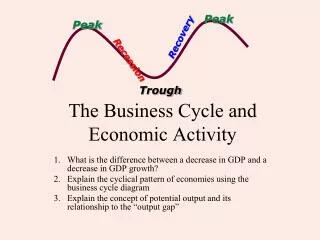
Understanding and Predicting the Solar Activity Cycle. Dr. David H. Hathaway NASA/NSSTC 2006 July 28. Outline. Significance of the Solar Activity Cycle Activity Cycle Characteristics Solar Interior Characteristics Magnetic Dynamo Models Predictions Conclusions.

E N D
Understanding and Predicting the Solar Activity Cycle Dr. David H. Hathaway NASA/NSSTC 2006 July 28
Outline • Significance of the Solar Activity Cycle • Activity Cycle Characteristics • Solar Interior Characteristics • Magnetic Dynamo Models • Predictions • Conclusions
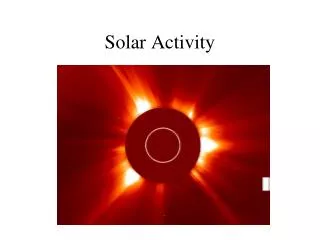
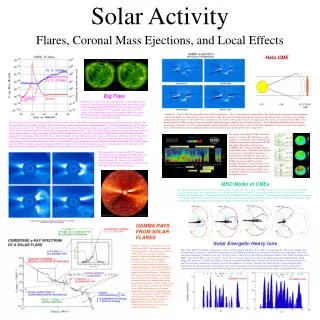
Solar Activity: The Bastille Day Event Solar activity includes: flares, prominence eruptions, coronal mass ejections, solar energetic particle events, and high-speed solar wind streams from coronal holes.
Effects of Solar Activity: On Satellites Radiation (protons, electrons, alpha particles) from solar flares and coronal mass ejections can damage electronics on satellites. Heating of the Earth’s upper atmosphere increases satellite drag. • 1991 GOES • 1995 Deutsche Telekom • 1996 Telesat Canada • 1997 Telstar 401 • 2000/07/14 ASCA • 2003 Mars Odyssey • 4500 spacecraft anomalies over last 25 years
Effects of Solar Activity: On Power Grids Solar disturbances shake the Earth’s magnetic field. This sets up huge electrical currents in power lines and pipe lines. The solar storm of March 13th 1989 fried a $10M transformer in NJ. The same storm interrupted power to the province of Quebec for 6 days.
Effects of Solar Activity: On Climate? Yearly Sunspot Numbers and Reconstructed Northern Hemis-phere Temperature (Mann, Bradley & Hughes Nature 392, 779-787, 1998) smoothed with an 11-year FWHM tapered Gaussian and trimmed to valid smoothed data. The correlation coefficient from the overlapping period is 0.78.
Activity Cycles on Other Stars Activity cycles are also seen on other stars by measuring photometric changes in Ca II K-line emission. Cycle periods vary with the stellar rotation rate relative to the convection timescale.
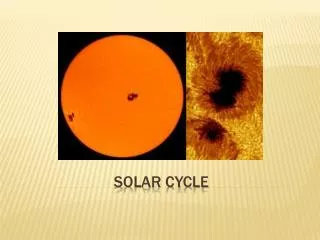
Sunspot Number and Solar Activity Sunspot number is well correlated with solar activity. The long sunspot number record helps to characterize the solar cycle. Sunspot Area 10.7cm Radio Flux GOES X-Ray Flares Total Irradiance Geomagnetic aa index Climax Cosmic-Ray Flux
The “11-year” Sunspot Cycle [Schwabe, 1844] The sunspot cycle periods are normally distributed about 131 months and are asymmetric in shape (rapidly rising and slowly declining - large cycles reach maximum sooner than small ones).
The Maunder Minimum Dalton Minimum [Maunder, 1894] Sunspot cycles vary widely in amplitude with occasional periods of inactivity like the Maunder Minimum (1645-1715).
Sunspot Latitude Drift [Carrington, 1858] Sunspots appear in two bands on either side of the equator. These bands spread in latitude and migrate toward the equator as the cycle progresses. Cycles often overlap at minimum.
Active Region Tilt: Joy’s Law [Hale et al., 1919] Active regions (sunspot groups) are tilted so that the following spots are slightly poleward of the preceding spots. This tilt increases with latitude. Howard (1991)
Magnetism is the Key Magnetic fields produce sunspots and are the source of the solar atmospheric structures and solar activity.
Hale’s Polarity Law [Hale, 1924] The polarity of the preceding spots in the northern hemisphere is opposite to the polarity of the preceding spots in the southern hemisphere. The polarities reverse from one cycle to the next.
The Sun’s Magnetic Cycle Magnetic field erupts through the surface as tilted bipoles in two bands on either side of the equator. Individual regions decay by spreading out over the surface. Remnant magnetic elements are sheared apart by differential rotation and carried poleward by a meridional flow.
Polar Field Reversals [Babcock, 1959] The polarity of the polar magnetic fields reverses at about the time of the solar activity maximum.
The Solar Interior Energy is generated in the core and transported by radiation outward through the core and the radiative zone. At about 70% of the way to the surface the temperature drops from 15MK to 2MK and metals (C, N, O) start to recombine – increasing the opacity. Convective motions then carry the energy to the surface.
Helioseismology Patches of the Sun’s surface rise and fall with a period of about 5-minutes. This is seen in the Doppler shifts of spectral lines as alternating red-shifts and blue-shifts. These 5-minute oscillations are acoustic waves trapped inside the Sun. Their characteristics provide information about the interior structure and dynamics.
Internal Rotation Rate Helioseismic determinations of the internal rotation rate show that the latitudinal differential rotation seen at the surface extends through the convection zone. Layers of strong radial shear are found near the surface and at the base of the convection zone (the tachocline). Thompson et al. (1996)
Internal Meridional Flow Helioseismic determinations of the internal meridional flow show that the poleward flow seen at the surface extends into the convection zone. An equatorward return flow must exist at the base of the convection zone but has not yet been observed.
Internal Convective Flows Granules Granules are the smallest convection cells with diameters of ~ 1500 km and lifetimes of ~ 20 minutes. They are driven by radiative cooling in the photosphere and are well modeled with numerical simulations (Radiation-Hydro Codes). Stein & Nordlund (1998)
Internal Convective Flows Supergranules Supergranules are much larger cells with diameters of ~ 30,000 km and lifetimes of ~ 1 day. They produce the near surface shear layer and transport weak magnetic field elements to their boundaries where they form the magnetic (chromospheric) network. They are NOT well modeled by numerical simulations.
Internal Convective Flows Giant Cells Giant Cells are the largest cells with diameters of ~ 200,000 km and lifetimes of ~ weeks. They produce the Sun’s differential rotation and meridional flow. They have been modeled by numerical simulations but are NOT well observed. Meisch et al. (2000) Zhao & Kosovichev (2004)
The Sun’s Magnetic Dynamo • The high conductivity of the fluid within the Sun makes the magnetic field and the fluid flow together (frozen in field lines). • The high pressures found inside the Sun insures that the fluid flow controls the magnetic field (except in the centers of sunspots). • At least four processes are involved in the Sun’s magnetic dynamo: • Stretching by differential rotation • (the Omega Effect) • Lifting and twisting by buoyancy and rotation • (the Alpha Effect) • Transporting by the meridional flow • Reconnecting by diffusion
Lift and Twist – The α-Effect Through the 50s, 60s, and much of the 70s it was thought that the α-effect would be produced in the bulk of the convection zone by Giant Cell convective motions. However … the amount of twisting would be far too large and … magnetic flux tubes should be buoyant and rise rapidly (days) to the surface. This led to a new possibility – strong magnetic flux tubes produced by the shear in the tachocline should rise and twist slightly … reproducing the Joy’s Law tilt in active regions! Abbett, Fisher, Fan (2001) Caligari, Moreno-Insertis, Schüssler (1995)
Dynamo Wave or Meridional Flow? ω-effect ~ dΩ/dr α-effect ~ u·curl u Dynamo waves travel along surfaces of constant angular velocity in a direction determined by the sign of α· and a period ~ 1/√αω With meridional flow the activity moves in the flow direction with period ~ 1/Velocity
Dikpati & Charbonneau Dynamo This is a 2D kinematic dynamo which uses the observed internal differential rotation, a realistic meridional circulation, a reasonable diffusivity, and a parameterized α-effect. It produces a reversing magnetic field configuration with a 22-year period and an equatorward propagation of active zones. In/CCW Out/CW
Drift Rate – Period Anti-correlation The Dikpati & Charbonneau model predicts an anti-correlation between meridional flow speed and cycle period. We find that the sunspot cycle period is anti-correlated with the drift velocity at cycle maximum. The faster the drift rate the shorter the period. R=-0.5 95% Significant
Drift Rate – Amplitude Correlations The Dikpati & Charbonneau model also predicts a long “memory” for the cycle – surface activity now influences activity 20 years in the future. We found that the drift velocity at cycle maximum is correlated to the amplitude of the second following (N+2) cycle maximum. The correlation is much weaker for the immediately following maximum. R=0.7 99% Significant
Solar Cycle Predictions Prediction at month 30 Predicting the level of activity once a cycle has started works well starting about 2-years after mimimum. We fit the data to a two parameter function of starting time and amplitude.
Predicting the Next Cycle Dalton Minimum In the past, a variety of techniques have been used to predict the amplitude of the next cycle. The techniques generally fall into one of two groups – cycle statistics techniques and precursor techniques. Cycle statistics – average cycle, linear trend, periodic variations?
Precursor Techniques Precursor techniques use aspects of the Sun and solar activity prior to the start of a cycle to predict the size of the next cycle. The two leading contenders are: 1) geomagnetic activity from high-speed solar wind streams and 2) polar field strength just prior to the start of the cycle. Geomagnetic Prediction ~ 160 ± 25 (Hathaway & Wilson 2006) Polar Field Prediction ~ 75 ± 8 (Svalgaard, Cliver, Kamide 2005)
The Dynamo Prediction Dikpati, de Toma & Gilman (2006) have fed sunspot areas and positions into their numerical model for the Sun’s dynamo and reproduced the amplitudes of the last eight cycles with unprecedented accuracy (RMS error < 10). Cycle 24 Prediction ~ 165 ± 15
Caveats • They used our data – which was 20% high for cycle 20. (Their prediction for the actual size of cycle 20 was good but later cycles were also predicted accurately in spite of the error in the input data.) • They kept the meridional flow speed constant. (They allow it to change in cycle 23 and find a 10% change in the prediction. Similar variations in meridional flow speed should have occurred in the past.) • A independent confirmation of the model is needed.
Long-Range Prediction Based on the fast drift rates at the maximum of the last (22nd) cycle (red oval – northern hemisphere, yellow oval – southern hemisphere) we predict a large amplitude for the next cycle (24th). Slow drift rates during cycle 23 indicate a very small cycle 25.
Conclusions • Dynamo models with deep meridional flow provide a simple explanation for the 11-year period of the sunspot cycle and suggest that surface conditions now are indicators of solar activity some 20 years into the future. • Explicit modeling of the cycles since 1880 using sunspot areas as input accurately predicts the amplitudes of the last eight cycles and predicts a large amplitude for the next cycle. • The Geomagnetic precursors, the secular trend in cycle amplitudes, and the drift rate of the active latitudes all indicate a much larger than average cycle 24. • Polar field strength indicates a very small amplitude cycle 24 (or should that be cycle 25?)