Download
1 / 27
270 likes | 490 Views
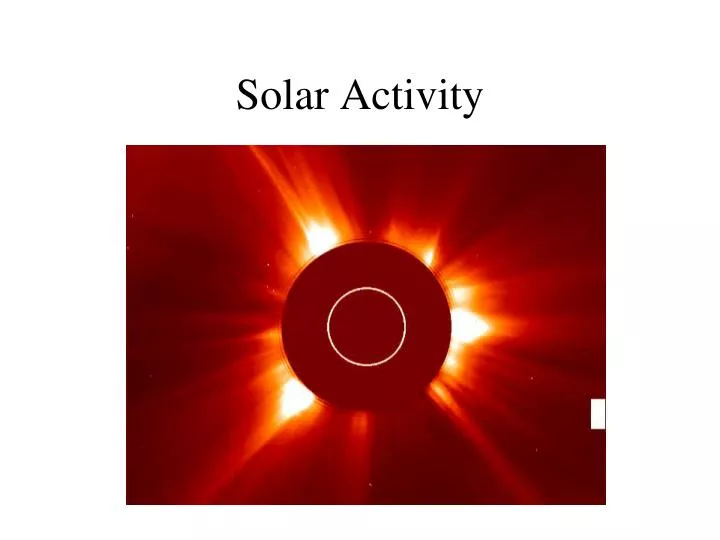
Solar Activity. Views of the Chromosphere – During an eclipse (above), Through an H-Alpha filter, (right). The flash spectrum of the chromosphere. Note the spectrum is an emission- line spectrum. The Solar Corona as seen in white light (above) and X-rays (right). The Chromosphere.

E N D
Views of the Chromosphere – During an eclipse (above), Through an H-Alpha filter, (right)
The flash spectrum of the chromosphere. Note the spectrum is an emission- line spectrum
The Solar Corona as seen in white light (above) and X-rays (right)
The Chromosphere Can be studied 1) During total solar eclipses 2) Using Narrow-band (H-Alpha) filters Spectral characteristics: Lower Chromosphere: Strong Balmer lines 10,000K Middle Chromosphere: Weaker Balmer lines, lines of ionized helium 20,000K Top Chromosphere: Lines of highly ionized iron 500,000 – 1,000,000K (also called the Transition Region)
The Corona • Outermost layer of the solar atmosphere • Can be observed during solar eclipses or with a coronograph. • Visible-light spectrum: scattered light from photosphere • Ultraviolet & X-ray spectrum: emission lines of highly • ionized gases. • The temperature ranges from 500,000K – 3.5 million K. Why is the Corona so hot? Magnetic heating
The solar corona is very hot, but gives out much less light than the much cooler photosphere. Why? • We can only see the corona during an eclipse, so we • don’t see light from it otherwise • B. The corona is made of very low density gases, so much • less light is emitted despite the high temperature • C. The corona does emit light, but mostly in the ultraviolet • part of the spectrum
The solar corona is so hot that it is not gravitationally bound to the sun. Thus it is continuously expanding outward, producing the solar wind. The solar wind consists of protons and electrons (and other charged particles). At the Earth, the velocity of the solar wind is about 400km/s.
Sunspots: are cool regions associated with magnetic fields. They are the source of many types of solar activity and are also called “active regions”.
Sunspots appear dark because they are cooler than the surrounding photo- sphere. They are cooler because they are associated with regions of intense magnetic fields (about 1000 gauss, about 1000X stronger than the average solar magnetic field). This magnetic field inhibits convection below the sunspot.
The Zeeman effect can be used to detect and measure magnetic field strengths on the sun.
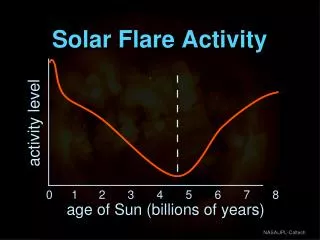
The sun undergoes an 11 year sunspot cycle during which the sun goes through a sunspot maximum and a sunspot minimum.
Sunspots generally come in pairs with opposite magnetic polarities. This magnetogram of the sun shows two major sunspot groups in the northern and southern hemispheres. Notice that the polarity of the spots is reversed in the two hemispheres. These polarities flip with each sunspot cycle – making the magnetic cycle 22 years instead of 11 years
Let us suppose that at this time the leading sunspots in the northern hemisphere have a N polarity. In 33 years what will be the polarity of the leading sunspots? A. North B. South C. neither
The sunspot cycle since 1600. Notice the lack of sunspots from about 1650 – 1710; this is called the Maunder Minimum.
The Butterfly diagram shows that at the beginning of a sunspot cycle, sunspots appear at high solar latitudes. As the cycle advances, sunspots appear closer and closer to the equator.
The main features of the solar cycle can be understood from the Babcock Model
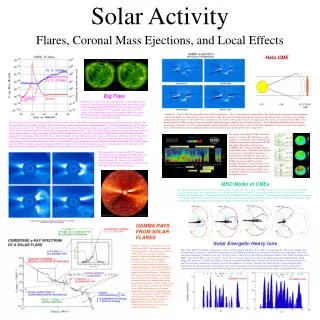
Solar Activity (continued) Prominences are loops or sheets of glowing gas ejected from an active region on the solar surface (sunspots). Quiescent Prominences: are long lasting curtains of chromospheric gas.
Eruptive Prominences: Short-lived chromospheric eruptions, often in the form of loops.
Solar Flares: are sudden releases of energy in a solar active region. They occur when magnetic energy, which has been stored in the solar atmosphere is suddenly released in a magnetic reconnection event. Solar flares are the single most energetic phenomenon in our solar system. Coronal Mass ejections are often associated with solar flares. During a solar flare, electromagnetic radiation across the entire EM spectrum can be emitted.
Solar flares are associated with phenomena here on earth, such as the aurora borealis. Solar flares release high energy protons and electrons. These can interact with the earth’s magnetic field to produce the aurora borealis. Solar flares can also interact with the power grid and cause widespread power outages.
Cause of the Aurora After a solar flare, it takes 2 to 4 days for the solar wind and charged particles to reach the Earth. When these events arrive, they strike the magnetosphere like a shock wave and inject huge amounts of energy into the magnetic field, often causing enormous and unusual auroras.