Download
1 / 1
20 likes | 167 Views
Solar Activity. Flares, Coronal Mass Ejections, and Local Effects. Halo CME. Big Flare

E N D
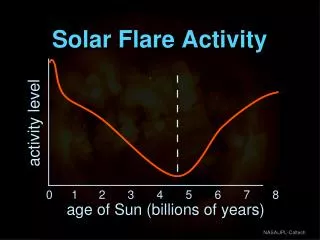
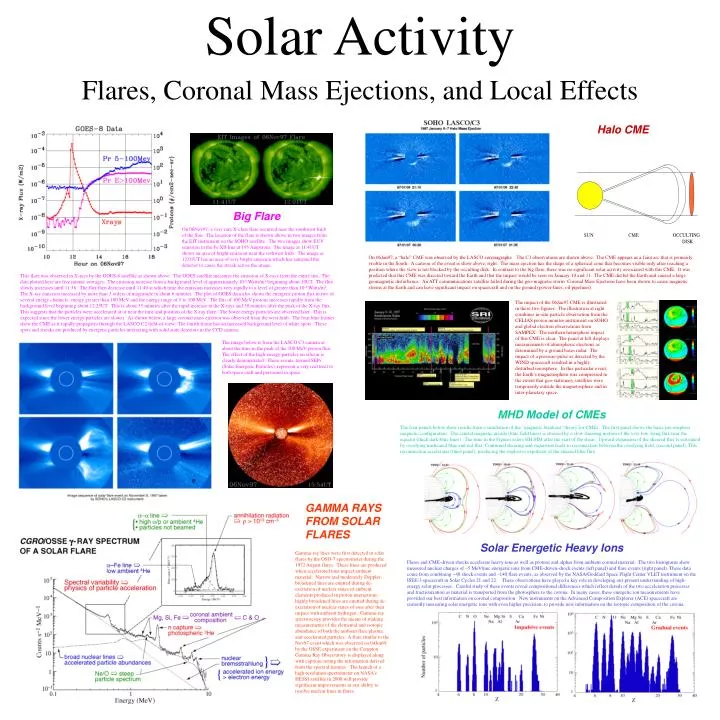
Solar Activity Flares, Coronal Mass Ejections, and Local Effects Halo CME Big Flare On 06Nov97, a very rare X-class flare occurred near the southwest limb of the Sun. The location of the flare is shown above in two images from the EIT instrument on the SOHO satellite. The two images show EUV emission in the Fe XII line at 195 Angstrom. The image at 11:41UT shows an area of bright emission near the sothwest limb. The image at 12:01UT has an area of very bright emission which has saturated the detector to cause the streak across the image. On 06Jan97, a “halo” CME was observed by the LASCO coronagraphs. The C3 observations are shown above. The CME appears as a faint arc that is primarily visible in the South. A cartoon of the event is show above, right. The mass ejection has the shape of a spherical cone that becomes visible only after reaching a position where the view is not blocked by the occulting disk. In contrast to the big flare, there was no significant solar activity associated with this CME. It was predicted that this CME was directed toward the Earth and that the impact would be seen on January 10 and 11. The CME did hit the Earth and caused a large geomagnetic disturbance. An ATT communications satellite failed during the geo-magnetic storm Coronal Mass Ejections have been shown to cause magnetic storms at the Earth and can have significant impact on spacecraft and on the ground (power-lines, oil pipelines). This flare was observed in X-rays by the GOES-8 satellite as shown above. The GOES satellite measures the emission of X-rays from the entire sun. The data plotted here are five minute averages. The emission increase from a background level of approximately 10-8 Watts/m2 beginning about 10UT. The flux slowly increases until 11:36. The flux then decrease until 11:49 at which time the emission increases very rapidly to a level of greater than 10-4 Watts/m2. The X-ray emission increased by more than 3 orders of magnitude in about 6 minutes. The plot of GOES data also shows the energetic proton flux in two of several energy channels: energy greater than 100 MeV and the energy range of 5 to 100 MeV. The flus of 100 MeV protons increases rapidly from the background level beginning about 12:25UT. This is about 35 minutes after the rapid increase in the X-rays and 30 minutes after the peak of the X-ray flux. This suggests that the particles were accelerated at or near the time and position of the X-ray flare. The lower energy particles are observed later. This is expected since the lower energy particles are slower. As shown below, a large coronal mass ejection was observed from the west limb. The four blue frames show the CME as it rapidly propagates through the LASCO C2 field-of-view. The fourth frame has an increased background level of white spots. These spots and streaks are produced by energetic particles interacting with solid state detectors in the CCD camera. The impact of the 06Jan97 CME is illustrated in these two figures. The illustration at right combines in-situ particle observation from the CELIAS proton monitor instrument on SOHO and global electron observations from SAMPEX. The northern hemisphere impact of this CME is clear. The panel at left displays measurements of atmospheric electrons as determined by a ground bases radar. The impact of a pressure-pulse as detected by the WIND spacecraft resulted in a highly disturbed ionosphere. In this particular event, the Earth’s magnetosphere was compressed to the extent that geo-stationary satellites were temporarily outside the magnetosphere and in inter-planetary space. The image below is from the LASCO C3 camera at about the time in the peak of the 100 MeV proton flux. The effect of the high-energy particles on silicon is clearly demonstrated. These events, termed SEPs (Solar Energetic Particles), represent a very real treat to both space craft and personnel in space. MHD Model of CMEs The four panels below show results from a simulation of the "magnetic breakout "theory for CMEs. The first panel shows the basic pre-eruption magnetic configuration. The central magnetic arcade (blue field lines) is stressed by a slow shearing motion of the very low-lying flux near the equator (thick dark-blue lines). The time in the Figures refers HH:MM after the start of the shear. Upward expansion of the sheared flux is restrained by overlying unsheared blue and red flux. Continued shearing and expansion leads to reconnection between the overlying field, (second panel). This reconnection accelerates (third panel), producing the explosive expulsion of the sheared blue flux. e • GAMMA RAYS FROM SOLAR FLARES • Gamma-ray lines were first detected in solar flares by the OSO-7 spectrometer during the 1972 August flares. These lines are produced when accelerated ions impact ambient material. Narrow and moderately Doppler-broadened lines are emitted during de-excitation of nuclear states of ambient elements produced in proton interactions; highly broadened lines are emitted during de-excitation of nuclear states of ions after their impact with ambient hydrogen. Gamma-ray spectroscopy provides the means of making measurements of the elemental and isotopic abundance of both the ambient flare plasma and accelerated particles. A flare similar to the Nov97 event which was observed on 04Jun91 by the OSSE experiment on the Compton Gamma Ray Observatory is displayed along with captions noting the information derived from the spectral features. The launch of a high-resolution spectrometer on NASA’s HESSI satellite in 2000 will provide significant improvements in our ability to resolve nuclear lines in flares. Solar Energetic Heavy Ions Flares and CME-driven shocks accelerate heavy ions as well as protons and alphas from ambient coronal material. The two histograms show measured nuclear charges of ~5 MeV/nuc energetic ions from CME-driven-shock events (left panel) and flare events (right panel). These data come from combining ~40 shock events and ~140 flare events, as observed by the NASA/Goddard Space Flight Center VLET instrument on the ISEE-3 spacecraft in Solar Cycles 21 and 22. These observations have played a key role in developing our present understanding of high-energy solar processes.Careful study of these events reveal compositional differences which reflect details of the two acceleration processes and fractionization as material is transported from the photosphere to the corona. In many cases, these energetic ion measurements have provided our best information on coronal composition New instruments on the Advanced Composition Explorer (ACE) spacecraft are currently measuring solar energetic ions with even higher precision, to provide new information on the isotopic composition of the corona. MHD Modeling of a CME The four panels below show results from a simulation of the "magnetic breakout "theory for CMEs (Antiochos et al., Astrophys. J., 510, 485,1999.) The first panel shows the basic pre-eruption magnetic configuration. The central magnetic arcade (blue field lines) is stressed by a slow shearing motion of the very low-lying flux near the equator (thick dark-blue lines). The time in the Figures refers HH:MM after the start of the shear. Upward expansion of the sheared flux is restrained by overlying unsheared blue and red flux. Continued shearing and expansion leads to reconnection between the overlying field, (second panel). This reconnection accelerates (third panel), producing the explosive expulsion of the sheared blue flux.