Download

1 / 30
440 likes | 946 Views
The Balanced Scorecard Methodology. Presentation by: Informed Risk Decisions; 2010. Informed Risk Decisions. The Balanced Scorecard (BSC) - "One of the most important management practices of the past 75 years" HBR. 1996. Enterprise-wide Strategic Management. Measurement and Reporting.

E N D
The Balanced Scorecard Methodology Presentation by: Informed Risk Decisions; 2010 Informed Risk Decisions
The Balanced Scorecard (BSC) - "One of the most important management practices of the past 75 years" HBR 1996 Enterprise-wide Strategic Management Measurement and Reporting Alignment and Communication 1992 2009 • Articles in Harvard Business Review: • “The Balanced Scorecard — Measures that Drive Performance” January - February 1992 • “Putting the Balanced Scorecard to Work” September - October 1993 • “Using the Balanced Scorecard asa Strategic Management System” January - February 1996 Endorsement by Gartner Group 2009: The balanced scorecard methodology developed by Drs. Kaplan and Norton extends beyond financial measures to link vision to action. The Harvard Business Review has acclaimed the balanced scorecard as one of the most influential ideas of the past 75 years Source: Gartner Group; 2009 Feature Article: Business Value of IT — Non-financial Measurements “The Balanced Scorecard” is translated into 18 languages Informed Risk Decisions 2000 Based on presentation of Balanced Scorecard Collaborative
Financial and non-financial metrics - Key Performance Indicators (KPI) Key Performance Indicators (KPI) are financial and non-financial metrics used to quantify objectives to reflect strategic performance of an organization. In times of uncertainty, managing the factors that drive business value becomes especially significant. Standard financial measures are insufficient for capturing all the critical elements of business worth. It is crucial to establish standards for non-financial measurement of business performance. These metrics would include, for example, leading-edge indicators for an enterprise's ability to innovate as well as manage demand, supply and shared services. Such metrics should be standard, objective and capable of being audited. Supported by new reference models, methodologies and advancement in IT, performance measurement can provide greater insights into the cause-and-effect relationships between operating events and financial results. Such knowledge depends on measures that expand the traditional financial metrics to encompass non-financial elements that offer a platform for management of performance. The balanced scorecard methodology developed by Drs. Kaplan and Norton extends beyond financial measures to link vision to action. The Harvard Business Review has acclaimed the balanced scorecard as one of the most influential ideas of the past 75 years. Based on: Gartner Group Feature Article: Business Value of IT — Non-financial Measurements; 2009
The Balanced Scorecard Methodology:Making the strategy tangible, understood and shared • At the highest level, the Balanced Scorecard is a framework that helps organizations to translate strategy into operational objectives that drive both behavior and performance. • Source: Balanced Scorecard Collaborative/Palladium • The BSC is a structured approach to performance measurement and performance management that links the organization’s strategic thinking to the activities necessary to achieve desired results • The BSC is a vehicle for communicating an organization’s strategic direction and for measuring achievements towards these predetermined objectives • The BSC clearly establishes linkage between strategic objectives, the measures for determining progress, the stretch targets established, and the focused initiatives needed to move the organization forward to meet those organizational goals • Source: USA, Department of Energy Procurement System
Strategy “A general method for achieving specific objectives. It describes the essential resources and their amounts, which are to be committed to achieving those objectives. It describes how resources will be organized, and the policies that will apply for the management and use of those resources." Source: Engineering Strategy Development; Definition of Strategy; Feb 2004 http://www.johnstark.com/es5.html Please note: The term Strategy is intuitively perceived as relating to Enterprise-wide strategic objectives; however it may describe also departmental/functional objectives/goals/targets such as of Customer Service dept…
The Strategy Landscape: Strategy Implementation, monitoring and control Implementation: Hands on Wheel Enterprise-wide strategic objectives and/or departmental/functional goals and targets Key Performance Indicators (KPI) put to work by applying, adapting and tailoring the Balanced Scorecard methodology • Drilling down • Analyzing • Tracking Cause-Effect validity Monitoring & Control Informed Risk Decisions
Business Intelligence (BI)/Analytics and Balanced Scorecard Balanced Scorecard is to be positioned as top-level business intelligence linking operational achievements to vision, strategy and financial & non-financial measure combination The Balanced Scorecard framework “Business intelligence uses knowledge management, data warehouse[ing], data mining and business analysis to identify, track and improve key processes and data, as well as identify and monitor trends in corporate, competitor and market performance.” Source: www.bettermanagement.com Informed Risk Decisions
There is a consistent set of “best practices” applied by successful BSC users 1. MOBILIZE CHANGE THROUGH EXECUTIVE LEADERSHIP 2. TRANSLATE STRATEGY TO OPERATIONAL TERMS 1.1 Top leadership committed 1.2 Case for change clearly articulated 1.3 Leadership team engaged 1.4 Vision and strategy clarified 1.5 New way of managing understood 1.6 Program manager identified 2.1 Strategy map developed 2.2 Balanced Scorecard created 2.3 Targets established 2.4 Initiatives rationalized 2.5 Accountability assigned STRATEGY-FOCUSED ORGANIZATION BEST PRACTICES 3. ALIGN THE ORGANIZATIONTO THE STRATEGY 5. GOVERN TO MAKE STRATEGY A CONTINUAL PROCESS 3.1 Corporate role defined 3.2 Corporate – SBUs aligned 3.3 SBU – Support units aligned 3.4 SBU – External Partners aligned 3.5 Board of directors aligned 5.1 BSC reporting system established 5.2 Strategy review meetings conducted 5.3 Planning, budgeting, and strategy integrated 5.4 HR and IT planning linked to strategy 5.5 Process management linked to strategy 5.6 Knowledge sharing linked to strategy 5.7 Strategy Management Office established 4. MOTIVATE TO MAKE STRATEGY EVERYONE’S JOB 4.1 Strategy awareness created 4.2 Personal goals aligned 4.3 Personal incentives aligned 4.4 Competency development aligned Source: Balanced Scorecard Collaborative/Palladium - www.bscol.com ; NOW - http://www.thepalladiumgroup.com ;
Getting acquainted with the Balanced Scorecard Informed Risk Decisions
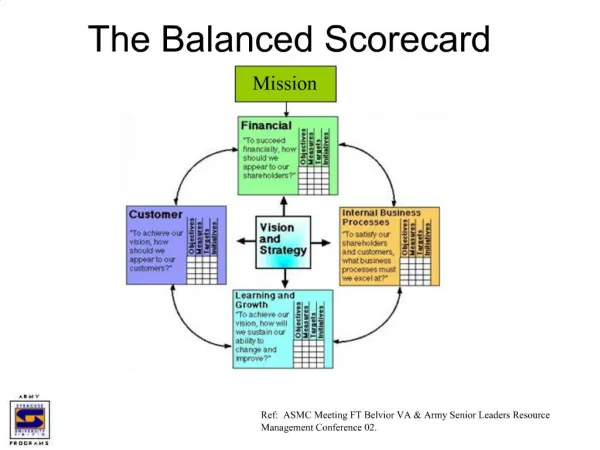
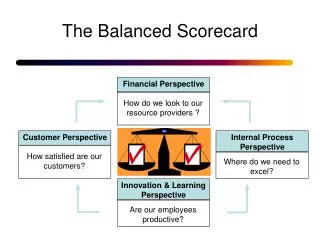
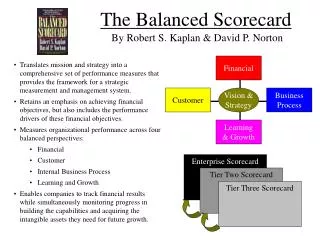
What is meant by “Balanced” • Financial • Perspective • Objectives • Key Performance Indicators • Targets • Initiatives • Customer • Perspective • Objectives • Key Performance Indicators • Targets • Initiatives • Internal Process Perspective • Objectives • Key Performance Indicators • Targets • Initiatives Strategy • Learning & Growth Perspective • Objectives • Key Performance Indicators • Targets • Initiatives The task of developing a comprehensive strategy demands systematic consideration and integration of various perspectives. We have to balance between financial and non-financial considerations and apply a measure combination. The basic framework as conceived by Kaplan and Norton, 1996 is presented below. The actual contents of each perspective are tailored to the specific organizational/unit realities, needs and challenges. For making the strategy explicit we use the Strategy Map/s Kaplan and Norton, 1996
Tailoring to the specific organizational/unit realities, needs and challenges - government procurement service example FINANCIAL - Optimum Cost Efficiency of Purchasing Operations; Cost Reasonableness of Actions INTERNAL BUSINESS PROCESSES - Acquisition Excellence - Most Effective Use of Contracting Approaches - Streamlined Processes - On-Time Delivery - Supplier Satisfaction - Socio-economics MISSION VISION STRATEGY CUSTOMER - Customer Satisfaction - Effective Service/Partnership LEARNING AND GROWTH - Access to Strategic Information - Employee Satisfaction - Organization Structured for Continuous Improvement - Quality Workforce Source: USA, Department of Energy Procurement System
What do we balance • Financial versus Non-financial measures • Tangible versus Intangible assets • Long-term versus Short-term Goals • Internal versus External Perspective • Performance Drivers versus Outcomes Cause-effect relationships hypotheses
Example of the Basic Building Blocks of the Strategy and displaying the strategy’s cause-effect hypotheses 1. The economic model of key levers driving financial performance Financial Perspective Return on Investment Revenue Strategy Productivity Strategy Sources of Growth Sources of Productivity 2. The value proposition of target customers Customer Perspective Value Proposition Quality Function Image Relatio-ship Price Time Internal Process Perspective 3. The value chain of core business processes “Build the Brand” “Make the Sale” “Deliver the Product” “Service Exceptionally” 4. The critical enablers of performance improvement, change and learning Learning & Growth Perspective Staff Competencies Climate for Action + + Technology Infrastructure Source: Presentation of Balanced Scorecard Collaborative
Making the strategy’s hypotheses explicit: the Strategy Map “A strategy map for a Balanced Scorecard makes explicit the strategy’s hypotheses. Each measure of a Balanced Scorecard becomes embedded in a chain of cause-and-effect logic that connects the desired outcomes from the strategy with the drivers that will lead to the strategic outcomes.” The Strategy-Focused Organization by Kaplan and Norton 2001
Strategy Maps – A Better Way to Communicate Strategy Educate and Communicate: Build awareness and understanding of organization strategy across the workforce. Executive consensus and accountability: Building the map eliminates ambiguity and clarifies responsibility. Promote Transparency: Communicate with and educate constituents, partners, oversight bodies, and the general public. Ensure Alignment: Each sub-unit and individual link their objectives to the map. Source: "Using Balanced Scorecard Technology to Create Strategy-Focused Public Sector Organizations", Robert S. Kaplan, April 21, 2004, pg. 20
Kaplan and Norton's Generic Strategy Map template Please keep in mind that the positioning of a perspective on the template does not in any way indicate the relative importance of the perspective. The Generic Strategy Map template has to customized to the organization’s/department's/unit's particular strategy
Operational Management Processes Regulatory and Social Processes • Environment • Safety and Health • Employment • Community Innovation Processes • Opportunity ID • R&D Portfolio • Design/Develop • Launch Customer Management Processes • Supply • Production • Distribution • Risk Management • Selection • Acquisition • Retention • Growth A Strategy Map Represents How the Organization Creates Value Productivity Strategy Long-Term Shareholder Value Growth Strategy Financial Perspective Improve Cost Structure Increase Asset Utilization Expand Revenue Opportunities Enhance Customer Value Customer Value Proposition Customer Perspective Price Quality Availability Selection Functionality Service Partnership Brand Product / Service Attributes Relationship Image Internal Perspective Human Capital Learning and Growth Perspective Information Capital Organization Capital Leadership Alignment Teamwork Culture Source: Kaplan R. S. & Norton D. P.,2004,Strategy Maps: Converting intangible assets into tangible outcomes, HBR
Financial Customer Sample Strategy Map: Consumer Bank Internal Process “Our success comes from… F2 - Maximize traditional revenue sources F3 - Grow non-traditional revenue sources F4 - Manage financial resources for maximum risk-adjusted return F1 - Achieve sustainable double-digit net income growth …enduring value-added relationships… Learning and Growth C1 - “Understand me and give me the right information and advice.” C2 - “Give me convenient access to the right products.” C3 - “Appreciate me, and get things done easily, quickly, and right.” C4 - “Be involvedin my communities.” …which is all about great products and personal service… Customer Partnerships Innovation Operational Excellence Communicate the full value proposition Consistently deliver the full value proposition Provide premium service to delight and retain valuable customers Migrate customers to the right channel Broaden offering through internal & external partnerships Maximize efficiency and quality of business processes Identify and recognize high-potential relationships Focus on the critical few activities Develop attractive new products & services Segment markets and target prospects …delivered by a motivated & prepared work force.” L1 - “We develop, recognize, retain, and hire great people.” L2 - “I’m developing the skills I need to succeed.” L3 - “We understand the strategy and know what we need to do.” L4 - “We have the information and tools we need to do our jobs.”
Strategy Map example: Diagram of the cause-and-effect relationships between strategic objectives Statement of what strategy must achieve and what’s critical to its success How success in achieving the strategy will be measured and tracked Strategic Theme: Operating Efficiency The level of performance or rate of improvement needed Key action programs required to achieve objectives Financial Profitability Fewer planes More customers Customer Flight Is on time Lowest prices Objectives Measurement Target Initiative Internal • On Ground Time • On-Time Departure • 30 Minutes • 90% • Cycle time optimization • Fast ground turnaround Fast ground turnaround Learning Ground crew alignment BSC Terminology Extending the Map into Objectives, Measurements, Targets and Initiatives Based on : Presentation of Balanced Scorecard Collaborative
The Organizational Framework Horizontal and Vertical Alignment !!! Strategy Objectives Measures Strategic Business Unit (SBU) Department Team/ Individual Ensure Alignment: Each sub-unit and individual link their objectives to the map.
Cause - effect hypothesesWe must test hypotheses of cause-effect relationships “The key for implementing strategy is to have everyone in the organization clearly understand the underlying hypotheses, to align resources with the hypotheses, to test the hypotheses continually, and to adapt as required in real time.” The Strategy-Focused Organization by Kaplan and Norton 2001 Strategies and action plans are based on cause-effect hypotheses e.g. assumptions and Ifs (as far as strategy is concerned IF is the longest word) “If we do….., we will raise more income” Mapping the strategy highlights the assumed cause-effect relationships. We must continuously test and check the validity the hypotheses They might have been wrong and/or the assumed environmental/internal realities have been changed. CHANGE is the name of the game We must continuously monitor implementation Informed Risk Decisions
ProcessApplications Develop Loan Programs Receive Applications Service Mortgages Housing Strategy Map example: Cause-effect hypotheses Mission IncreaseHome Ownership Increase Market Share Reduce Claims Business Partners Homeowners Customer Processes Value Chain (faster, better, or cheaper) Skills, Technology, Motivation Strategic Competencies Strategic Technology Climate for Action Applications Infrastructure Source: Presentation by Patrick Plunkett Department of Housing & Urban Development July 20, 2006
Step 3 Draft a Strategy Map With Linkages And Themes Step 5 Select Strategic Initiatives Step 2 Build a Strategic Architecture Step 4 Determine Measures and Targets Step 6 Plan for implementation of the SFO Balanced Scorecard Six Step Development Process Step 1 Develop a Project Plan Typically 8-12 Weeks
Putting the BSC to work Presentation of the metrics and their visualization
http://vaperforms.virginia.gov/Scorecard/ScorecardatGlance.pdfhttp://vaperforms.virginia.gov/Scorecard/ScorecardatGlance.pdf
Radar Chart Dashboard Balanced Scorecard
Some of the Indicators of Good Balanced Scorecard 1. Executive InvolvementStrategic decision makers must validate and own the strategy and related measures 2. Cause-and-Effect RelationshipsEvery objective selected should be part of a chain of cause and effect linkages that represent the strategy A good Balanced Scorecard will “tell the story” of your strategy in actionable terms. 3. Balance between outcome and leading measuresThere should be a balance of outcome measures and leading measures to facilitate anticipatory management 4. Financial LinkageEvery objective can ultimately be related to financial results 5. Linkage of Initiatives and Measures: Each initiative should be based on a gap between baseline and target. Source: Balanced Scorecard Collaborative/Palladium