Download
1 / 15
170 likes | 524 Views
The Breeder’s equation R = h 2 S R = The response to selection h 2 = heritability (in the narrow sense) S = the selection differential. Mean of population. Mean of selected individuals. 3.5. 1.5. The Breeder’s equation R = h 2 S

E N D
The Breeder’s equation R = h2 S R = The response to selection h2 = heritability (in the narrow sense) S = the selection differential
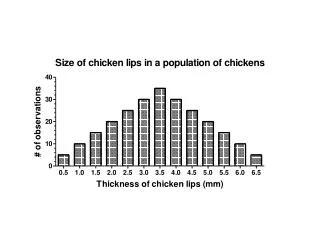
Mean of population Mean of selected individuals 3.5 1.5 The Breeder’s equation R = h2 S R = The response to selection h2 = heritability (in the narrow sense) S = the selection differential
Mean of population (a) Mean of selected individuals (b) 3.5 1.5 The Breeder’s equation R = h2 S R = The response to selection h2 = heritability (in the narrow sense) S = the selection differential S = a – b = 2
Mean of population (a) Mean of selected individuals (b) 3.5 1.5 The Breeder’s equation R = h2 S R = The response to selection h2 = heritability (in the narrow sense) S = the selection differential S = a – b = 2 if h2 = 0.5, what is the response to selection?
Original population mean If h2 = 0.5 R Response to selection Mean of offspring
1 Fitness (w) 0 Gene frequency/genotype frequency/phenotype frequency Fitness function – the relationship between phenotype and the survival probability.
1 Fitness (w) 0 Gene frequency/genotype frequency/phenotype frequency An example of heterozygote superiority (overdominance
1 Fitness (w) 0 Gene frequency/genotype frequency/phenotype frequency An example of homozygote superiority (underdominance)
1 Fitness (w) 0 Gene frequency/genotype frequency/phenotype frequency Truncated selection – the probability of survival is truncated abruptly
What you need to do for your Brassica breeding Breed these to achieve your goal of changing the frequency of a trait in a population.
What you need to do for your Brassica breeding Breed these plants to use in your calculations of heritability (h2). Breed these to achieve your goal of changing the frequency of a trait in a population.
How do we find heritability? Controlled experiments h2 = slope of the best fit line Heritability (in the narrow sense) reflects the degree to which offspring resemble their parents. Or The degree to which variation in the population (offspring) is due to variation in genes (parents).