Download
1 / 14
140 likes | 251 Views
Air-Sea CO 2 Fluxes in the Caribbean Sea Rik Wanninkhof 1 , Are Olsen 2 , Joaquin Trinanes 3 , and Betty Huss 1. Project: Ocean Carbon Sources and Sinks (using VOS) -

E N D
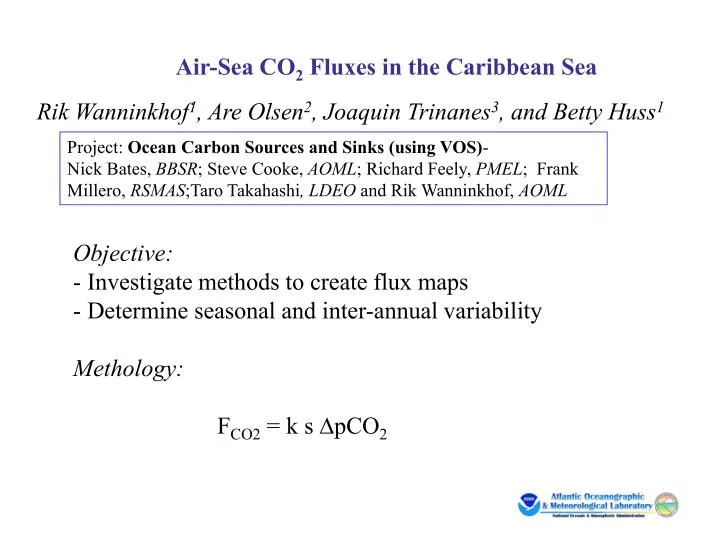
Air-Sea CO2 Fluxes in the Caribbean Sea Rik Wanninkhof1, Are Olsen2, Joaquin Trinanes3, and Betty Huss1 Project: Ocean Carbon Sources and Sinks (using VOS)- Nick Bates, BBSR; Steve Cooke, AOML; Richard Feely, PMEL; Frank Millero, RSMAS;Taro Takahashi, LDEO and Rik Wanninkhof, AOML Objective: - Investigate methods to create flux maps - Determine seasonal and inter-annual variability Methology: FCO2 = k s ∆pCO2
Status of Estimating Air-Sea CO2 Fluxes: * The global CO2 climatology provides global pattern and the global uptake by the ocean * It does not yield changes in regional fluxes over time * For an accurate global carbon accounting regional estimates are necessary * To attribute changes in atmospheric growth rate we need annual estimates of sources and sinks Goal: Constrain regional fluxes to 0.2 Pg C year-1 For this goal we need ∆pCO2 to following resolution ( equivalent to:0.1 Pg C yr-1) d(∆pCO2) a A-1 U-2
Creation of Flux Maps * Obtain data from ships (and other platforms)- COSP program * Create regional algorithms with biogeochemical and physical parameters that are measured at higher frequency and with regional coverage * Use high data coverage to create flux maps that captures spatial and temporal variability Remotely sensed products used: Q-Scat Wind: for gas transfer Reynolds SST: for pCO2w (tied to ship SST) Position:different biogeochemical provinces Chlorophyll: productivity Mixed layer depth: entrainment Salinity: delineation of provinces Sea surface height: entrainment
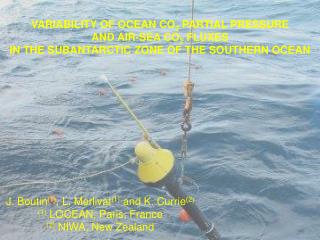
Testbed: Caribbean Sea • High resolutionmeasurements (14 day repeat occupation) • Good satellite coverage and auxiliary measurements (e.g. skin temp) http://www.aoml.noaa.gov/ocd/gcc/explorer_introduction.php
Caribbean Sea: A well behaved test case: pCO2w = a + b SST + C Lat + D long Yearly algorithms are very similar Small changes can in large part be explained by rise in atmospheric CO2 2002: fCO2sw =10.18 * SST+ 0.5249 * lat - 0.2921 * lon + 52.19, N = 40204 rms = 5.7 uatm, r2= 0.87 2003: fCO2sw =10.45 * SST+ 0.3629 * lat - 0.5144 * lon + 36.52, N= 60373 rms=5.9 uatm, r2 =0.92 2004: fCO2sw =10.64 * SST + 0.9745 * lat - 0.3687* lon + 30.68, N = 86695 rms = 7 uatm, r2 = 0.85
Interpolation Schemes Kriging interpolation Interpolation fCO2w = f( SST, position)
Regional Patterns of Seasonal fluxes in 2004 : Regional extent of algorithms based on data from NOAA ship BROWN
Annual fluxes 2002- 2004 : 2002 = -4.8x10¹¹ mol = 0.4 % global uptake 2003 = -0.48x10¹¹ mol = 0.04 % global uptake 2004 = -13.6x10¹¹ mol = 1 % global uptake (Global uptake = 1.6 Pg C = -1.3 1014 mol)
Weekly Fluxes • Small annual regional fluxes are caused compensating effect of local and temporal sinks and sources • Weekly fluxes can be as as great as annual fluxes • Most year-to-year variability is in late winter/ early spring
Near Future: Operational Future: Operational Autonomous platforms SENUS- A self navigating Autonomous sailboat D. Palmer AOML E. Schlieben FAU Utilize in situ sensors like currently deployed on buoys In dire need of VOS !!! Instrumentation: Establishing an arrangement with General Oceanics to build underway pCO2 systems
(Near) Future directions: Flux maps of the North AtlanticHeike Lueger- in collaboration with Carbo-Oceans partners Database Years: 2002-2004 Data points: 157,987 Nuka Arctica Skogafoss Falstaff Ron Brown
Provinces in the North Atlantic* ARCT – Atlantic Arctic SARC – Atlantic Subarctic NADR – North Atlantic Drift GSTR – Gulf Stream NWCS – Northwest Atlantic Continental Shelf ARCT / SARC NWCS NADR GSTR *following Longhurst (1995)
Subpolar Region - pCO2w= 12*SST - 0.4*SST2 + 0.6*MLD – 0.7*LON + 0.8*LAT + 161 RMS=14 R2= 0.6 MLD- Argo profiling float data Data points: 5,177 (no April) Years :2003-2004 VOS: Nuka Arctica Skogafoss
Conclusions • 3-years of data suggest that the pCO2- SST algorithms are robust for the Caribbean • Over 3 years very small net fluxes into the ocean but large changes over the year • Most of the interannual variability appears in the Spring • Method shows promise in the North Atlantic by inclusion of other parameters • Completion of the surface ocean CO2 observing system is slowed by lack of platforms • Alternate platforms should be investigated