Download
1 / 18
180 likes | 328 Views
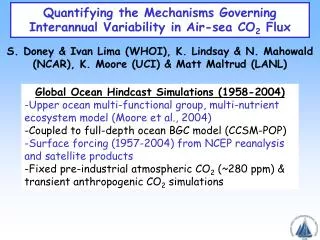
Quantifying the Mechanisms Governing Interannual Variability in Air-sea CO 2 Flux. S. Doney & Ivan Lima (WHOI), K. Lindsay & N. Mahowald (NCAR), K. Moore (UCI) & Matt Maltrud (LANL). Global Ocean Hindcast Simulations (1958-2004)

E N D
Quantifying the Mechanisms Governing Interannual Variability in Air-sea CO2 Flux S. Doney & Ivan Lima (WHOI), K. Lindsay & N. Mahowald (NCAR), K. Moore (UCI) & Matt Maltrud (LANL) Global Ocean Hindcast Simulations (1958-2004) -Upper ocean multi-functional group, multi-nutrient ecosystem model (Moore et al., 2004) -Coupled to full-depth ocean BGC model (CCSM-POP) -Surface forcing (1957-2004) from NCEP reanalysis and satellite products -Fixed pre-industrial atmospheric CO2 (~280 ppm) & transient anthropogenic CO2 simulations
Winds, Heat & Freshwater Fluxes Dust/iron CO2 O2 Light Net Community Prod. Circulation Regenerated Prod. Winter mixed layer Nutrient/ DIC Supply Export Remineralization Physical & Biological Controls pCO2 = f(Temp., Salinity, DIC, Alkalinity) + (+) +- Biology only one factor on surface pCO2 & air-sea CO2 flux;
1:1 nDIC Temp Alk Freshwater W. Eq. Pacific
Dissolved Inorganic Carbon Regression of surface pCO2 anomalies on forcing terms ~1 driving term 0 minor term <0 compensating term Masked in areas of low pCO2’ and low correlation Temperature
Alkalinity Regression of surface pCO2 anomalies on forcing terms ~1 driving term 0 minor term <0 compensating term Masked in areas of low pCO2’ and low correlation Freshwater
Annual inventory change & flux anomalies X’: I/t = Q’ srf. flux + A’ horz. advection + E’ eddies + V’ vert. adv. + P’ net comm. prod. + other Q’ 0 A’ E’ I 100 P’ V’
Physics Only Dust Only Dust Only Physics Only
SeaWiFS Dust r=0.82 Physics r=0.11 Dust & Physics r=0.48 Smoothed w/ annual filter
Monthly Annual
-Models as tools for identifying ocean biogeochemical mechanisms • -Regional partitioning of factors driving air-sea CO2 flux • Southern Ocean wind speed variability • Subtropics thermal • Tropics/high latitude biology and circulation on nDIC • Tropical Indo-Pacific freshwater • -Non-linear interactions of dust and climate variability
Model Obs Is low dust deposition downwind of Australia in 1997/1998 realistic? Tentative answer: yes Chen et al. precip slightly above average for 1997 and 1998 Low dep due to low source Two met stations close to source area: 946720 and 944820 have fewer dust events than average in 1997 and 1998 Low dep due to high precip All values are anomalies from climatological mean (1979-2004): black monthly: Yellow line: 0: blue line: annual mean
Physics r=0.56 SeaWiFS Dust r=0.71 Dust & Physics r=0.60 Monthly anomalies