Download

1 / 41
410 likes | 593 Views
Assessment of the Suomi NPP VIIRS Aerosol EDRs for Provisional Maturity Level . H. Huang, J. Huang, J. Jackson, H. Liu, M. Oo , H. Zhang, ??? April 26 , 2013. VIIRS Aerosol Cal/Val Team. Criteria for Provisional Maturity Status. Product quality may not be optimal

E N D
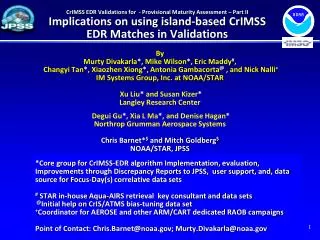
Assessment of the SuomiNPPVIIRS Aerosol EDRs for Provisional Maturity Level H. Huang, J. Huang, J. Jackson, H. Liu, M. Oo, H. Zhang, ??? April 26, 2013
Criteria for Provisional Maturity Status • Product quality may not be optimal • Product accuracy is determined for a broader (but still limited) set of conditions. • No requirement to demonstrate compliance with specifications. • Incremental product improvements still occurring • DR history and future planned efforts will be shown • Version control is in effect • General research community is encouraged to participate in the QA and validation of the product, but need to be aware that product validation and QA are ongoing • Users are urged to consult the EDR product status document prior to use of the data in publications • Ready for operational evaluation 3
Overview of Data Products VIIRS aerosol EDRs 4
Aerosol EDR in Beta product • AOT • very good agreement with MODIS and AERONET over ocean • overall high positive bias over land compared to MODIS and AERONET • APSP • some skill over ocean • no quantitative value over land • SM • no quantitative value
Data Quality Assessment Objectives and Methods for Provisional • Objectives: • Establish how well VIIRSAOTs match collocated Moderate Resolution Imaging Spectroradiometer(MODIS) retrievals. • Establish how well VIIRSAOTs match collocated AErosolROboticNETwork (AERONET) observations and retrievals. • Establish how well VIIRSAOTs represent the global aerosol system without benefit of MODIS or AERONET’s collocations to choose conditions. • Methods: • Comparison with other satellite-derived AOT: • co-located data • non-colocated data • Comparison with ground measurements • AOT at stationary sites • AOT from ships
Data used in evaluation Data used for AOT and APSP • Satellite-derived aerosol data • VIIRSEDR and IP products • MODIS Aqua aerosol products • MISR aerosol product • Ground measurements • AERONET aerosol data (land and coastal sites) • MAN data (deep ocean cruise data)
Time periods used inmaturity status evaluation • Changes in algorithm dictated 2-3 time intervals to be used in analysis for Provisional • Processing error (more on slide “Critical DRs”) • introduced on Oct 15, 2012 • corrected on Nov 27, 2012 • Processing coefficient update (see next slide) • intended to reduce high AOT bias over land • introduced on Jan 22, 2013 • Land: May-Sep, 2012, Dec-Jan, 2012, Feb-Mar, 2013 • Ocean: May-Sep, 2012, Dec-Mar, 2013
Reduction of high AOT bias over land • The significant positive AOT bias over land, reported during the Beta maturity review, was attributed to the surface reflectance band ratios used (pre-launch values) • The pre-launch surface reflectance band ratios used in the land inversion were computed using MODIS / AERONET match-up data • Originally computed for use in the MOD09 MODIS Surface Reflectance product and adopted by the VIIRS Aerosol algorithm • The surface reflectance band ratios were recomputed using VIIRS / AERONET match-up data • time period? # and location of AERONET sites? • DR4989, operational as of January 21, 2013 Mx/M5 surface reflectance band ratios, x=1, 2, 3, 5, 11
Evaluation using VIIRS / AERONET (PGE)match-up data • Time periods: • Period 1: Reprocessed match-up data from May, 2012 through September 2012. Reprocessing was done on the ADL using the updated band ratios (BR). • Period 2: match-up data from December, 2012 through January, 2013 (before BR update) • Period 3: match-up data from January, 2013 through March, 2013 (after BR update) • Quality control criteria applied: Truth data source • AERONET level 1.5 inversion product • Match-up time window is +/- one hour • If two observations within the time window are available they are averaged VIIRS Aerosol EDR IP • High quality retrievals used • EDR area is 5x5 HCS around AERONET site • IP area is 51x51 HCS around AERONET site Area Match-up • Require 25% of retrievals in area to be high quality • Use average value of all high quality pixel
Period 1: Reprocessed Match-up Data • Test results show the updated ratios lead to • a significant reduction in AOT bias over land, • a moderate improvement in AOT STD over land, • a reduction in the number of match-up passing QC. • Performance over ocean continues to be good for the period extended from one month in Beta (May 2012) to five months (May-Sep, 2012). • Bias of AOT IP is somewhat larger than bias of AOTEDR.
Periods 2 and 3: PGE Match-up Data NOTE: Periods 2 and 3 used different with surface reflectance band ratios! Bias over land is about ± 0.02 (negative for Period 2 and positive for Period 3, but different periods, not an apple-to-apple comparison)
Comparison of AOT with MAN (1) • Maritime Aerosol Network (MAN) – cruise based aerosol measurements • MAN level 2 (L2) series average data are used. • Period: May – Sep 2012 (Oct 15, 2012) • 10/16-11/27, 2012: bad VIIRS data • Dec 2012: most ships at same location (port?) or only occasional measurements • MAN L2 data are not yet available for 2013 • Best quality VIIRSEDR (QF=3) and IP (QF=0) AOTs. • MAN’s observation time and location are used as reference • Box Mean Comparison - Selected VIIRSIPs/EDRs are • scanned (MidTime) within ± 30 minutes, • (Lat,Lon) within 0.5°x 0.5° box centered on MAN location
Aerosol Optical Thickness (AOT) Comparison with Satellite-derived aerosol products
Co-located VIIRS and MODISAOT Co-location method: • MODIS (L2) and VIIRS (IP/EDR) AOT are matched up in time within 5 minutes • Nearest neighbor VIIRSAOT is selected • Both MODIS over Land and over Ocean AOTs are filtered with MODIS Could Fraction = 0 (from aerosol cloud mask) • MODISAOT is filtered with the best MODIS Quality Assurance Land and Ocean Flag • VIIRSAOT is filtered with QF=3 (high quality) Time periods used: • Feb-Mar 2013: Land and Ocean • Dec 2012 – Mar 2013: Ocean only • Jun, Sep, Dec 2012 and Mar 2013: Ocean only
MODIS/Aqua vs. VIIRS AOT over Land ( Feb-Mar 2013) EDR IP • Co-located MODIS and VIIRS data are used. • Time period covers two months following the land surface reflectance ratio update. • Accuracy (bias) of EDR and IP AOT are comparable. • STD of IP AOT is larger than that of EDRAOT.
Maps of co-located gridded VIIRS and MODIS/Aqua AOT over land and ocean ( Feb-Mar 2013) • IP or EDR? • Over land, relative to MODIS, VIIRSAOT is still biased high in some places (e.g., Brazil) , while it is biased low at other places (e.g., India). • constant BR is not sufficient • Over ocean, spatial distribution of co-located 1-degree gridded VIIRS and MODIS/Aqua AOT are similar • with somewhat smaller VIIRSAOT at high latitude oceans.
MODIS/Aqua vs. VIIRSAOT Over Ocean( Dec 2012 to Mar 2013) EDR IP • Co-located MODIS and VIIRS data are used. • Time period is two months longer than for the land analysis on previous slide. • Accuracy (bias) and precision (STD) of EDR and IP AOT are comparable.
Maps of co-located gridded VIIRS and MODIS/Aqua AOT over ocean ( Dec 2012-Mar 2013) ?????
Non-colocated Data over Land (1) • Demonstration of effect of surface band ratio (BR, PCT) update on global scale. • VIIRSAOT retrievals were re-processed at STAR with updated BR. • Best quality data are gridded to 0.25 degree regular grid. • Only common grids are used • Monthly averages (arithmetic average of daily data) are plotted Global Mean: 0.204 Global Mean: 0.155 Global Mean: 0.153
Non-colocated Data over Land (2) • VIIRS-MODIS difference • VIIRS(PCT)-VIIRS(IDPS) difference
Hongqing has the same analysis using non-colocated, “any grid” data, that is when the monthly mean for a satellite and a particular is calculated even when the other satellite has no retrieval for that grid. The biases and stds are larger in this case. Should we show these?
Time series of AOT • Time period: 05/02/2012 – 03/26/2013 • VIIRS high quality EDR • MODIS (Aqua) “very good” quality retrievals over land and “top-3 quality” over water. Processing error Processing error surface refl. ratio update
AOT Product Timeline 28 Oct 2011 2 May 2012 15 Oct 2012 27 Nov 2012 22 Jan 2013 28
Note on AOT IP • IP AOT product includes AOT from interpolation and NAAPS or climatology. • The AOT field has sharp gradients (top) at the boundaries of VIIRS retrievals and filled data as indicated in the plot of Fill Value QF (middle). • Filtering the IP AOT with “High quality” flag recovers the VIIRSAOT IP (bottom). • Users should be made aware of this. Plots are for Feb 24, 2013.
AOT- Planned improvementsNDVI-dependent surface reflectance ratio • Surface reflectance band ratios are expected to depend on geographical location and state of vegetation (season). • SWIRNDVI definition • Describe technique and show figure
AOT- Planned improvementsNDVI-dependent surface reflectance ratio • VIIRS(NDVI)-VIIRS(PCT) difference
Aerosol particle size parameter (APSP)Comparison with aeronet
Period 1: Reprocessed Match-up Data • # of match-ups is much less than that for AOT, QC filter on AOT? • Test results show the updated land surface reflectance ratios lead to • reduction in the number of match-up passing QC • no improvement in bias, • some improvement in standard deviation of Angstrom Exponent over land, but not enough to make the product useful
Periods 2 and 3: PGE Match-up Data • NOTE: Periods 2 and 3 used different surface reflectance band ratios!
In perspectiveVIIRS vs. MODIS algorithm evolution • Lorraine’s slides on MODIS evolution