Download
1 / 54
540 likes | 648 Views
This lecture by Professor David A. Patterson discusses key concepts in input/output (I/O) benchmarks, storage systems, and automated data libraries in the context of computer science. It covers queuing theory, RAID techniques, storage I/O performance measures, and UNIX file system principles. The lecture highlights the significance of benchmarks in shaping technology fields, explores various storage devices and policies, and examines performance limits encountered in file server architectures.

E N D
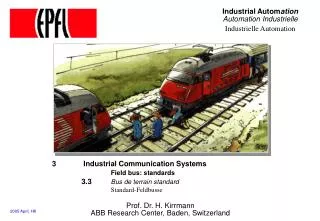
Lecture 14: I/O Benchmarks, Busses, and Automated Data Libraries Professor David A. Patterson Computer Science 252 Spring 1998
System server Queue Proc IOC Device Review: A Little Queuing Theory • Queuing models assume state of equilibrium: input rate = output rate • Notation: r average number of arriving customers/secondTser average time to service a customer (tradtionally µ = 1/ Tser)u server utilization (0..1): u = r x Tser Tq average time/customer in queue Tsys average time/customer in system: Tsys = Tq + TserLq average length of queue: Lq = r x Tq Lsys average length of system : Lsys = r x Tsys • Little’s Law: Lengthsystem = rate x Timesystem (Mean number customers = arrival rate x mean service time)
Review: Redundant Arrays of Disks (RAID) Techniques 1 0 0 1 0 0 1 1 1 0 0 1 0 0 1 1 • Disk Mirroring, Shadowing (RAID 1) Each disk is fully duplicated onto its "shadow" Logical write = two physical writes 100% capacity overhead 1 0 0 1 0 0 1 1 0 0 1 1 0 0 1 0 1 1 0 0 1 1 0 1 1 0 0 1 0 0 1 1 • Parity Data Bandwidth Array (RAID 3) Parity computed horizontally Logically a single high data bw disk • High I/O Rate Parity Array (RAID 5) Interleaved parity blocks Independent reads and writes Logical write = 2 reads + 2 writes Parity + Reed-Solomon codes
Review: RAID RAID sales • 1993: $3.4 billion on 214,667 arrays ( $15,000 / RAID) • 1996 forecast: $11 billion • 1997 forecast: $13 billion on 837,155 units • Source: DISK/TREND, 5/94 (415-961-6209)
Review: Storage System Issues • Historical Context of Storage I/O • Secondary and Tertiary Storage Devices • Storage I/O Performance Measures • Processor Interface Issues • A Little Queuing Theory • Redundant Arrarys of Inexpensive Disks (RAID) • ABCs of UNIX File Systems • I/O Benchmarks • Comparing UNIX File System Performance • I/O Buses
ABCs of UNIX File Systems • Key Issues • File vs. Raw I/O • File Cache Size Policy • Write Policy • Local Disk vs. Server Disk • File vs. Raw: • File system access is the norm: standard policies apply • Raw: alternate I/O system to avoid file system, used by data bases • File Cache Size Policy • % of main memory dedicated to file cache is fixed at system generation (e.g., 10%) • % of main memory for file cache varies depending on amount of file I/O (e.g., up to 80%)
ABCs of UNIX File Systems • Write Policy • File Storage should be permanent; either write immediately or flush file cache after fixed period (e.g., 30 seconds) • Write Through with Write Buffer • Write Back • Write Buffer often confused with Write Back • Write Through with Write Buffer, all writes go to disk • Write Through with Write Buffer, writes are asynchronous, so processor doesn’t have to wait for disk write • Write Back will combine multiple writes to same page; hence can be called Write Cancelling
ABCs of UNIX File Systems • Local vs. Server • Unix File systems have historically had different policies (and even file sytems) for local client vs. remote server • NFS local disk allows 30 second delay to flush writes • NFS server disk writes through to disk on file close • Cache coherency problem if allow clients to have file caches in addition to server file cache • NFS just writes through on file closeStateless protocol: periodically get new copies of file blocks • Other file systems use cache coherency with write back to check state and selectively invalidate or update
Network File Systems remote accesses local accesses
Typical File Server Architecture Limits to performance: data copying read data staged from device to primary memory copy again into network packet templates copy yet again to network interface No specialization for fast processing between network and disk
AUSPEX NS5000 File Server • Special hardware/software architecture for high performance NFS I/O • Functional multiprocessing I/O buffers UNIX frontend manages 10 SCSI channels specialized for protocol processing dedicated FS software
AUSPEX Software Architecture Limited control interfaces Primary control flow Primary data flow
Berkeley RAID-II Disk Array File Server to UltraNet Low latency transfers mixed with high bandwidth transfers "Diskless Supercomputers" to 120 disk drives
CS 252 Administrivia • Email URL of initial project home page to TA? • Upcoming events in CS 252 19-Mar Thu Send in Project Survey #2 20-Mar Fri Computer Pioneers and Pioneer Computers (Video, Gordon Bell Host) 23-Mar to 27-Mar Spring Break
I/O Benchmarks • For better or worse, benchmarks shape a field • Processor benchmarks classically aimed at response time for fixed sized problem • I/O benchmarks typically measure throughput, possibly with upper limit on response times (or 90% of response times) • What if fix problem size, given 60%/year increase in DRAM capacity? Benchmark Size of Data % Time I/O Year I/OStones 1 MB 26% 1990 Andrew 4.5 MB 4% 1988 • Not much time in I/O • Not measuring disk (or even main memory)
I/O Benchmarks • Alternative: self-scaling benchmark; automatically and dynamically increase aspects of workload to match characteristics of system measured • Measures wide range of current & future • Describe three self-scaling benchmarks • Transacition Processing: TPC-A, TPC-B, TPC-C • NFS: SPEC SFS (LADDIS) • Unix I/O: Willy
I/O Benchmarks: Transaction Processing • Transaction Processing (TP) (or On-line TP=OLTP) • Changes to a large body of shared information from many terminals, with the TP system guaranteeing proper behavior on a failure • If a bank’s computer fails when a customer withdraws money, the TP system would guarantee that the account is debited if the customer received the money and that the account is unchanged if the money was not received • Airline reservation systems & banks use TP • Atomic transactions makes this work • Each transaction => 2 to 10 disk I/Os & 5,000 and 20,000 CPU instructions per disk I/O • Efficiency of TP SW & avoiding disks accesses by keeping information in main memory • Classic metric is Transactions Per Second (TPS) • Under what workload? how machine configured?
I/O Benchmarks: Transaction Processing • Early 1980s great interest in OLTP • Expecting demand for high TPS (e.g., ATM machines, credit cards) • Tandem’s success implied medium range OLTP expands • Each vendor picked own conditions for TPS claims, report only CPU times with widely different I/O • Conflicting claims led to disbelief of all benchmarks=> chaos • 1984 Jim Gray of Tandem distributed paper to Tandem employees and 19 in other industries to propose standard benchmark • Published “A measure of transaction processing power,” Datamation, 1985 by Anonymous et. al • To indicate that this was effort of large group • To avoid delays of legal department of each author’s firm • Still get mail at Tandem to author
I/O Benchmarks: TP by Anon et. al • Proposed 3 standard tests to characterize commercial OLTP • TP1: OLTP test, DebitCredit, simulates ATMs (TP1) • Batch sort • Batch scan • Debit/Credit: • One type of transaction: 100 bytes each • Recorded 3 places: account file, branch file, teller file + events recorded in history file (90 days) • 15% requests for different branches • Under what conditions, how report results?
I/O Benchmarks: TP1 by Anon et. al • DebitCredit Scalability: size of account, branch, teller, history function of throughput TPS Number of ATMs Account-file size 10 1,000 0.1 GB 100 10,000 1.0 GB 1,000 100,000 10.0 GB 10,000 1,000,000 100.0 GB • Each input TPS =>100,000 account records, 10 branches, 100 ATMs • Accounts must grow since a person is not likely to use the bank more frequently just because the bank has a faster computer! • Response time: 95% transactions take Š 1 second • Configuration control: just report price (initial purchase price + 5 year maintenance = cost of ownership) • By publishing, in public domain
I/O Benchmarks: TP1 by Anon et. al • Problems • Often ignored the user network to terminals • Used transaction generator with no think time; made sense for database vendors, but not what customer would see • Solution: Hire auditor to certify results • Auditors soon saw many variations of ways to trick system • Proposed minimum compliance list (13 pages); still, DEC tried IBM test on different machine with poorer results than claimed by auditor • Created Transaction Processing Performance Council in 1988: founders were CDC, DEC, ICL, Pyramid, Stratus, Sybase, Tandem, and Wang; 46 companies today • Led to TPC standard benchmarks in 1990,www.tpc.org
I/O Benchmarks: Old TPC Benchmarks • TPC-A: Revised version of TP1/DebitCredit • Arrivals: Random (TPC) vs. uniform (TP1) • Terminals: Smart vs. dumb (affects instruction path length) • ATM scaling: 10 terminals per TPS vs. 100 • Branch scaling: 1 branch record per TPS vs. 10 • Response time constraint: 90% Š2 seconds vs. 95% Š1 • Full disclosure, approved by TPC • Complete TPS vs. response time plots vs. single point • TPC-B: Same as TPC-A but without terminals—batch processing of requests • Response time makes no sense: plots tps vs. residence time (time of transaction resides in system) • These have been withdrawn as benchmarks
I/O Benchmarks: TPC-C Complex OLTP • Models a wholesale supplier managing orders • Order-entry conceptual model for benchmark • Workload = 5 transaction types • Users and database scale linearly with throughput • Defines full-screen end-user interface • Metrics: new-order rate (tpmC) and price/performance ($/tpmC) • Approved July 1992
I/O Benchmarks: TPC-D Complex Decision Support Workload • OLTP: business operation • Decision support: business analysis (historical) • Workload = 17 adhoc transactions • e,g., Impact on revenue of eliminating company-wide discount? • Synthetic generator of data • Size determined by Scale Factor: 100 GB, 300 GB, 1 TB, 3 TB, 10 TB • Metrics: “Queries per Gigabyte Hour” Power (QppD@Size) = 3600 x SF / Geo. Mean of queriesThroughput (QthD@Size) = 17 x SF / (time/3600)Price/Performance ($/QphD@Size) = $/ geo. mean(QppD@Size, QthD@Size) • Report time to load database (indices, stats) too • Approved April 1995
I/O Benchmarks: TPC-W Transactional Web Benchmark • Represent any business (retail store, software distribution, airline reservation, electronic stock trades, etc.) that markets and sells over the Internet/ Intranet • Measure systems supporting users browsing, ordering, and conducting transaction oriented business activities. • Security (including user authentication and data encryption) and dynamic page generation are important • Before: processing of customer order by terminal operator working on LAN connected to database system • Today: customer accesses company site over Internet connection, browses both static and dynamically generated Web pages, and searches the database for product or customer information. Customer also initiate, finalize and check on product orders and deliveries. • Started 1/97; hope to release Fall, 1998
TPC-C Performance tpm(c) Rank Config tpmC $/tpmC Database 1 IBM RS/6000 SP (12 node x 8-way) 57,053.80 $147.40 Oracle8 8.0.4 2 HP HP 9000 V2250 (16-way) 52,117.80 $81.17 Sybase ASE 3 Sun Ultra E6000 c/s (2 node x 22-way) 51,871.62 $134.46 Oracle8 8.0.3 4 HP HP 9000 V2200 (16-way) 39,469.47 $94.18 Sybase ASE 5 Fujitsu GRANPOWER 7000 Model 800 34,116.93 $57,883.00 Oracle8 6 Sun Ultra E6000 c/s (24-way) 31,147.04 $108.90 Oracle8 8.0.3 7Digital AlphaS8400 (4 node x 8-way) 30,390.00 $305.00 Oracle7 V7.3 8 SGI Origin2000 Server c/s (28-way) 25,309.20 $139.04 INFORMIX 9 IBM AS/400e Server (12-way) 25,149.75 $128.00 DB2 10 Digital AlphaS8400 5/625 (10-way) 24,537.00 $110.48 Sybase SQL
TPC-C Price/Performance $/tpm(c) Rank Config $/tpmC tpmC Database 1 Acer AcerAltos 19000Pro4 $27.25 11,072.07 M/S SQL 6.5 2 Dell PowerEdge 6100 c/s $29.55 10,984.07 M/S SQL 6.5 3 Compaq ProLiant 5500 c/s $33.37 10,526.90 M/S SQL 6.5 4 ALR Revolution 6x6 c/s $35.44 13,089.30 M/S SQL 6.5 5 HP NetServer LX Pro $35.82 10,505.97 M/S SQL 6.5 6 Fujitsu teamserver M796i $37.62 13,391.13 M/S SQL 6.5 7 Fujitsu GRANPOWER 5000 Model 670 $37.62 13,391.13 M/S SQL 6.5 8 Unisys Aquanta HS/6 c/s $37.96 13,089.30 M/S SQL 6.5 9 Compaq ProLiant 7000 c/s $39.25 11,055.70 M/S SQL 6.5 10 Unisys Aquanta HS/6 c/s $39.39 12,026.07 M/S SQL 6.5
TPC-D Performance/Price 300 GB Rank Config. Qppd QthD $/QphD Database 1 NCR WorldMark 5150 9,260.0 3,117.0 2,172.00 Teradata 2 HP 9000 EPS22 (16 node) 5,801.2 2,829.0 1,982.00 Informix-XPS 3 DG AViiON AV20000 3,305.81,277.7 1,319.00 Oracle8 v8.0.4 4 Sun - Ultra Enterprise 6000 3,270.61,477.8 1,553.00 Informix-XPS 5 Sequent NUMA-Q 2000 (32 way) 3,232.3 1,097.8 3,283.00 Oracle8 v8.0.4 Rank Config. Qppd QthD $/QphD Database 1 DG AViiON AV20000 3,305.8 1,277.7 1,319.00 Oracle8 v8.0.4 2 Sun Ultra Enterprise 6000 3,270.6 1,477.8 1,553.00 Informix-XPS 3 HP 9000 EPS22 (16 node) 5,801.2 2,829.0 1,982.00 Informix-XPS 4 NCR WorldMark 5150 9,260.0 3,117.0 2,172.00 Teradata 5 Sequent NUMA-Q 2000 (32 way) 3,232.3 1,097.8 3,283.00 Oracle8 v8.0.4
TPC-D Performance 1TB Rank Config. Qppd QthD $/QphD Database 1 Sun Ultra E6000 (4 x 24-way) 12,931.9 5,850.3 1,353.00 Infomix Dyn 2 NCR WorldMark (32 x 4-way) 12,149.23,912.3 2103.00 Teradata 3 IBM RS/6000 SP (32 x 8-way) 7,633.05,155.4 2095.00 DB2 UDB, V5 • NOTE: Inappropriate to compare results from different database sizes.
TPC-D Performance 1TB Rank Config. Qppd QthD $/QphD Database 1 Sun Ultra E6000 (4 x 24-way) 12,931.9 5,850.3 1,353.00 Infomix Dyn 2 NCR WorldMark (32 x 4-way) 12,149.2 3,912.3 2103.00 Teradata 3 IBM RS/6000 SP (32 x 8-way) 7,633.0 5,155.4 2095.00 DB2 UDB, V5
SPEC SFS/LADDIS Predecessor: NFSstones • NFSStones: synthetic benchmark that generates series of NFS requests from single client to test server: reads, writes, & commands & file sizes from other studies • Problem: 1 client could not always stress server • Files and block sizes not realistic • Clients had to run SunOS
SPEC SFS/LADDIS • 1993 Attempt by NFS companies to agree on standard benchmark: Legato, Auspex, Data General, DEC, Interphase, Sun. Like NFSstones but • Run on multiple clients & networks (to prevent bottlenecks) • Same caching policy in all clients • Reads: 85% full block & 15% partial blocks • Writes: 50% full block & 50% partial blocks • Average response time: 50 ms • Scaling: for every 100 NFS ops/sec, increase capacity 1GB • Results: plot of server load (throughput) vs. response time & number of users • Assumes: 1 user => 10 NFS ops/sec
Example SPEC SFS Result: DEC Alpha • 200 MHz 21064: 8KI + 8KD + 2MB L2; 512 MB; 1 Gigaswitch • DEC OSF1 v2.0 • 4 FDDI networks; 32 NFS Daemons, 24 GB file size • 88 Disks, 16 controllers, 84 file systems 4817
Willy • UNIX File System Benchmark that gives insight into I/O system behavior (Chen and Patterson, 1993) • Self scaling to automatically explore system size • Examines five parameters • Unique bytes touched: data size; locality via LRU • Gives file cache size • Percentage of reads: %writes = 1 – % reads; typically 50% • 100% reads gives peak throughput • Average I/O Request Size: Bernoulli, C=1 • Percentage sequential requests: typically 50% • Number of processes: concurrency of workload (number processes issuing I/O requests) • Fix four parameters while vary one parameter • Searches space to find high throughput
Example Willy: DS 5000 SpriteUltrix Avg. Access Size 32 KB 13 KB Data touched (file cache) 2MB, 15 MB 2 MB Data touched (disk) 36 MB 6 MB • % reads = 50%, % sequential = 50% • DS 5000 32 MB memory • Ultrix: Fixed File Cache Size, Write through • Sprite: Dynamic File Cache Size, Write back (Write cancelling)
Sprite's Log Structured File System Large file caches effective in reducing disk reads Disk traffic likely to be dominated by writes Write-Optimized File System • Only representation on disk is log • Stream out files, directories, maps without seeks • Problems: • Random access retrieval • Log wrap • Disk space utilization • Advantages: • Speed • Stripes easily across several disks • Fast recovery • Temporal locality • Versioning
Willy: DS 5000 Number Bytes Touched • Log Structured File System: effective write cache of LFS much smaller (5-8 MB) than read cache (20 MB) • Reads cached while writes are not => 3 plateaus
Summary: I/O Benchmarks • Scaling to track technological change • TPC: price performance as nomalizing configuration feature • Auditing to ensure no foul play • Througput with restricted response time is normal measure
Review: Storage System Issues • Historical Context of Storage I/O • Secondary and Tertiary Storage Devices • Storage I/O Performance Measures • Processor Interface Issues • A Little Queuing Theory • Redundant Arrarys of Inexpensive Disks (RAID) • ABCs of UNIX File Systems • I/O Benchmarks • Comparing UNIX File System Performance • I/O Buses
Interconnect Trends • Interconnect = glue that interfaces computer system components • High speed hardware interfaces + logical protocols • Networks, channels, backplanes message-based narrow pathways distributed arb memory-mapped wide pathways centralized arb
Backplane Architectures Distinctions begin to blur: SCSI channel is like a bus FutureBus is like a channel (disconnect/reconnect) HIPPI forms links in high speed switching fabrics
Bus-Based Interconnect • Bus: a shared communication link between subsystems • Low cost: a single set of wires is shared multiple ways • Versatility: Easy to add new devices & peripherals may even be ported between computers using common bus • Disadvantage • A communication bottleneck, possibly limiting the maximum I/O throughput • Bus speed is limited by physical factors • the bus length • the number of devices (and, hence, bus loading). • these physical limits prevent arbitrary bus speedup.
Bus-Based Interconnect • Two generic types of busses: • I/O busses: lengthy, many types of devices connected, wide range in the data bandwidth), and follow a bus standard(sometimes called a channel) • CPU–memory buses: high speed, matched to the memory system to maximize memory–CPU bandwidth, single device (sometimes called a backplane) • To lower costs, low cost (older) systems combine together • Bus transaction • Sending address & receiving or sending data
Bus Protocols Master Slave ° ° ° Control Lines Bus Master: has ability to control the bus, initiates transaction Bus Slave: module activated by the transaction Bus Communication Protocol: specification of sequence of events and timing requirements in transferring information. Asynchronous Bus Transfers: control lines (req., ack.) serve to orchestrate sequencing Synchronous Bus Transfers: sequence relative to common clock Address Lines Data Lines Multibus: 20 address, 16 data, 5 control, 50ns Pause
Synchronous Bus Protocols Clock Address Data Read Wait Read complete begin read Pipelined/Split transaction Bus Protocol Address Data Wait addr 1 addr 2 addr 3 data 0 data 1 data 2 wait 1 OK 1
Asynchronous Handshake Write Transaction Address Data Read Req. Ack. Master Asserts Address Next Address t0 : Master has obtained control and asserts address, direction, data Waits a specified amount of time for slaves to decode target\ t1: Master asserts request line t2: Slave asserts ack, indicating data received t3: Master releases req t4: Slave releases ack Master Asserts Data 4 Cycle Handshake t0 t1 t2 t3 t4 t5
Read Transaction Address Data Read Req Ack Master Asserts Address Next Address t0 : Master has obtained control and asserts address, direction, data Waits a specified amount of time for slaves to decode target\ t1: Master asserts request line t2: Slave asserts ack, indicating ready to transmit data t3: Master releases req, data received t4: Slave releases ack 4 Cycle Handshake t0 t1 t2 t3 t4 t5 Time Multiplexed Bus: address and data share lines
Bus Arbitration Parallel (Centralized) Arbitration Serial Arbitration (daisy chaining) Polling Bus Request Bus Grant BR BG BR BG BR BG M M M BG BR BGi BGo BGi BGo BGi BGo M M M A.U. BR BR BR M M M A.U. BR A C BR A C BR A C BR A
Bus Options Option High performance Low cost Bus width Separate address Multiplex address & data lines & data lines Data width Wider is faster Narrower is cheaper (e.g., 32 bits) (e.g., 8 bits) Transfer size Multiple words has Single-word transfer less bus overhead is simpler Bus masters Multiple Single master (requires arbitration) (no arbitration) Split Yes—separate No—continuous transaction? Request and Reply connection is cheaper packets gets higher and has lower latency bandwidth (needs multiple masters) Clocking Synchronous Asynchronous
SCSI: Small Computer System Interface • Clock rate: 5 MHz / 10 MHz (fast) / 20 MHz (ultra) • Width: n = 8 bits / 16 bits (wide); up to n – 1 devices to communicate on a bus or “string” • Devices can be slave (“target”) or master(“initiator”) • SCSI protocol: a series of “phases”, during which specif-ic actions are taken by the controller and the SCSI disks • Bus Free: No device is currently accessing the bus • Arbitration: When the SCSI bus goes free, multiple devices may request (arbitrate for) the bus; fixed priority by address • Selection: informs the target that it will participate (Reselection if disconnected) • Command: the initiator reads the SCSI command bytes from host memory and sends them to the target • Data Transfer: data in or out, initiator: target • Message Phase: message in or out, initiator: target (identify, save/restore data pointer, disconnect, command complete) • Status Phase: target, just before command complete